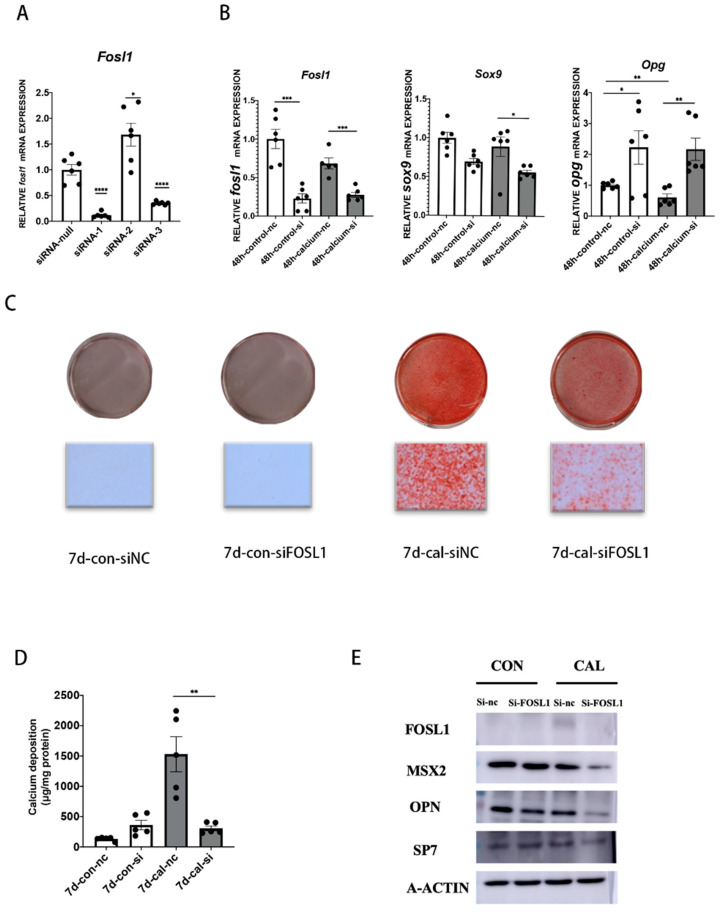
Figure 2.
Effect of FOSL1 on vascular calcification of VSMCs. (A) mRNA expression of FOSL1 was analyzed after being knocked down by three siRNAs for 48 h, n = 6 per group. (B) RT-qPCR was used to detect the expression of FOSL1, SOX9, and OPG, n = 6 per group. (C) Mouse VSMCs were transfected with siFOSL1 and siNC under calcium medium for seven days. ARS staining was used to detect mineral deposition. (D) In accordance with C, calcium content was measured by a calcium content assay kit, n = 5 per group. (E) Western blot analysis of FOSL1, MSX2, OPN, and SP7, n = 3 per group. Statistical analysis was performed using one-way ANOVA (Tukey honestly significant difference post hoc test) * p < 0.05, ** p < 0.01, *** p < 0.001, **** p < 0.0001.

