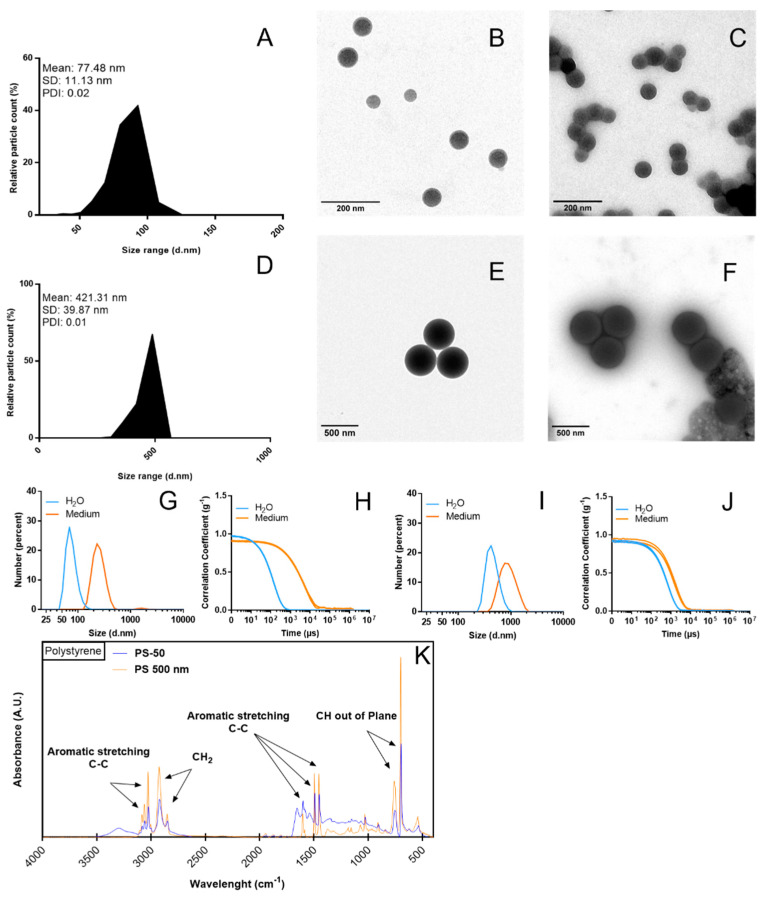
Figure 1.
Particle size distribution (number percent) in Milli-Q water dispersion and the culture medium can be observed for both PS-50 (A–C) and PS-500 (D–F). The changes in hydrodynamic size and the correlation of the measurements are detailed for PS-50 (G,H) and PS-500 (I,J). The chemical composition of PS-50 (blue curve) and PS-500 (orange curve) shows the major functional groups measured by FTIR (K). d.nm, diameter in nm. PDI, polydispersity index.

