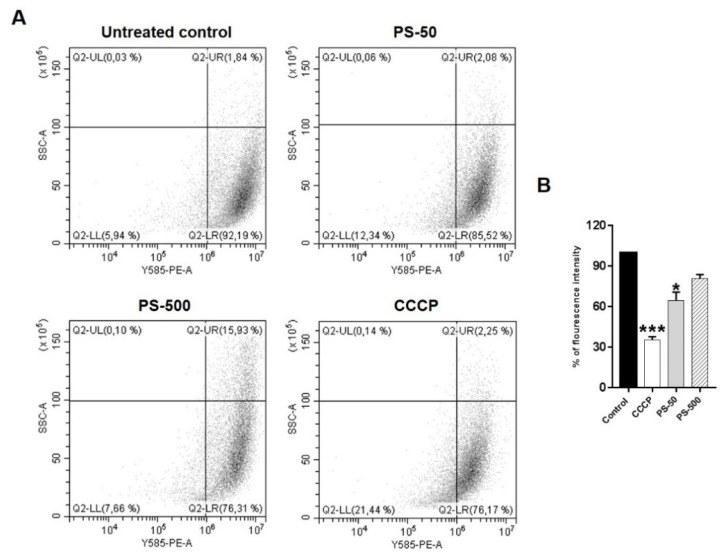
Figure 5.
The dot plots and graph indicate the loss of mitochondrial membrane potential due to PSNPL exposure in HNEpCs after 24 h of treatments. (A) The dot plots represented the decrease in fluorescence intensity as an indicator of loss of MMP due to treatment of HNEpCs with PSNPLs (far left quadrant) over the untreated control. CCCP acted as a positive control. (B) The graph represents the significant loss of MMP due to PS-50 in the treated cells vs. untreated control cells. * p ≤ 0.05, *** p ≤ 0.001.

