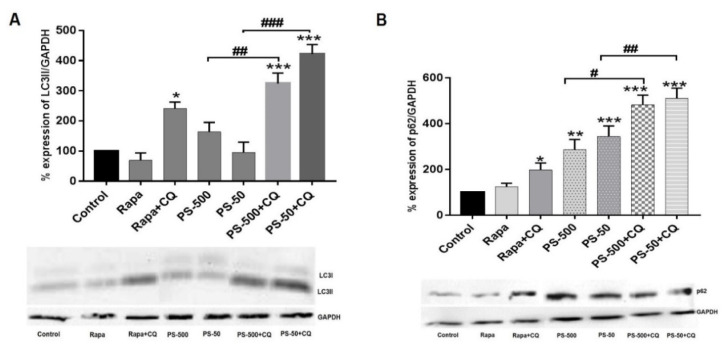
Figure 6.
Images showing the expression of important autophagy pathway proteins: LC3-II and p62 after exposure of HNEpCs to PS-50 and PS-500 alone or their combination with chloroquine for 24 h. (A) Histogram showing the quantitative changes in the levels of LC3-II expression in treated and untreated cells (top) and the respective Western blot for LC3-II (bottom). (B) Histogram showing the quantitative changes in the levels of p62 expression in the treated and untreated cells (top) and respective Western blot for p62 (bottom). * p ≤ 0.05, ** p ≤ 0.01, *** p ≤ 0.001 vs. untreated control; # p ≤ 0.05, ## p ≤ 0.01, ### p ≤ 0.001 (PS-50/PS-500 vs. PS-50/PS-500 + CQ). Note: Rapa and CQ in the graphs and blots represent rapamycin and chloroquine, respectively.

