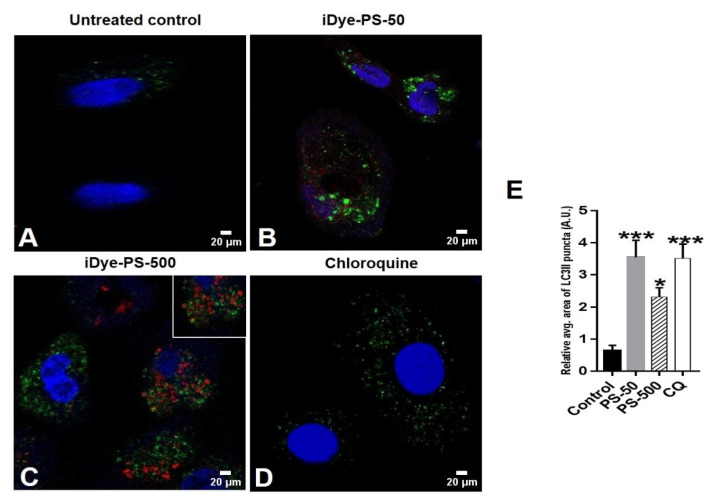
Figure 7.
The confocal images represent the accumulation of LC3II (green) after exposure of HNEpCs to 100 µg/mL of iDyePS-50 (red) and iDyePS-500 (red) for 24 h. (A) Untreated control. (B) Concurrent presence of iDyePS-50 (red) and LC3II puncta (green) in cytoplasmic regions. (C) Overlapping of iDyePS-500 (red) and LC3II (green) in cytoplasmic regions or colocalization of iDye-PS500 and LC3II (yellow, shown in inset). (D) chloroquine as a positive control for LC3II (green). (E) The histogram depicts the measurement of the relative average area of fluorescence (green/LC3II puncta, AU) due to iDyePS-50 and iDyePS-500 over the untreated control. * p ≤ 0.05, *** p ≤ 0.001 vs. untreated control.

