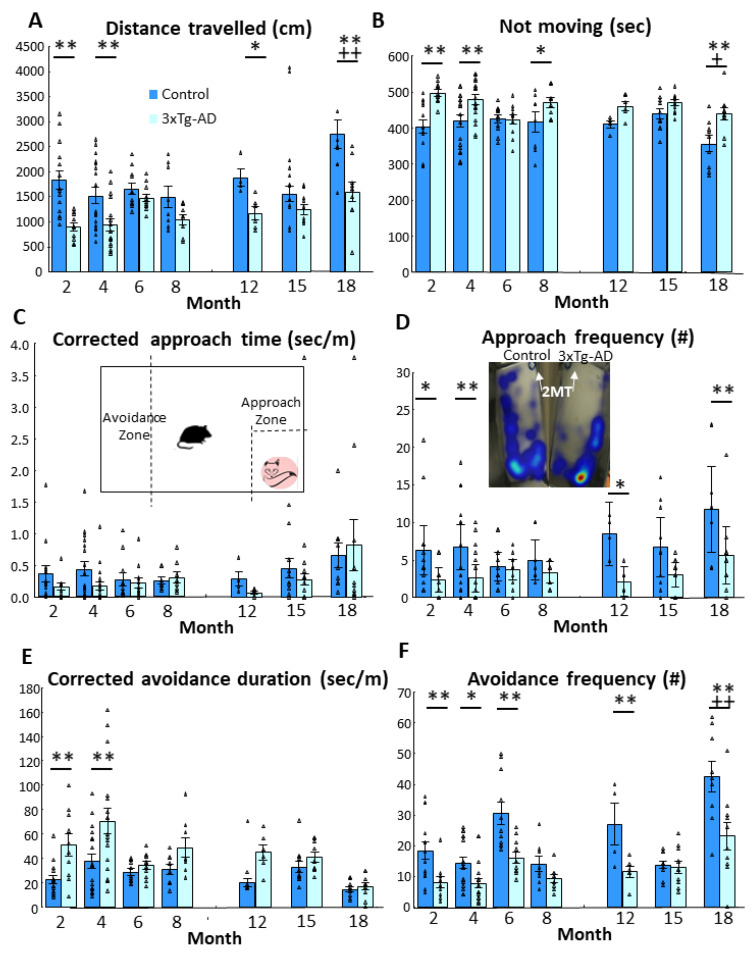
Figure 1.
Fox odor avoidance behavior in male mice in different age groups (2, 4, 6, 8, 12, 15 and 18 months). (A) Distance travelled in centimeters during 10 min. The 3xTg-AD animals moved significantly less than the control animals (p < 0.01). Additionally, the control groups moved more with age (age: p < 0.01, genotype × age: p = 0.05). (B) Time spent without movement (“freezing”). Consistently with the previous result, the 3xTg-AD animals spent more time immobile (p < 0.01). In both groups, the tendency to freeze decayed with age (p < 0.01). (C) Corrected approach time to fox odor zone and representative image of the fox odor test. Due to differences in locomotion between the genotypes we opted to measure the approach time in s/m. In both groups, older animals spent more time near the fox odor (2-methyl-2-thiazoline, 2MT; p < 0.05). (D) Frequency of approaching the odor zone and illustrative example of mouse activity by heatmap (the warm (i.e., red) areas’ values are high and the cold (i.e., dark blue) areas’ values are low). The 3xTg-AD approached the 2MT containing zone less frequently (p < 0.01), however, this also increased with age (p < 0.05). (E) Locomotion corrected time spent in the avoidance zone. The 3xTg-AD animals spent more time in the avoidance zone than their age matched controls (p < 0.01). (F) Number of entering into the avoidance zone. As 3xTg-AD animals spent more time in the avoidance zone, they entered this zone less frequently (p < 0.01). Moreover, the age increased the number of entries in the control group, but not in the 3xTg-AD animals (p < 0.05). Data are shown as the mean ± SEM. The individual raw data points are represented as triangles. * p < 0.05, ** p < 0.01 vs. Control; + p < 0.05, ++ p < 0.01 vs. 2 m. # = amount of approach and/or avoidance frequency.

