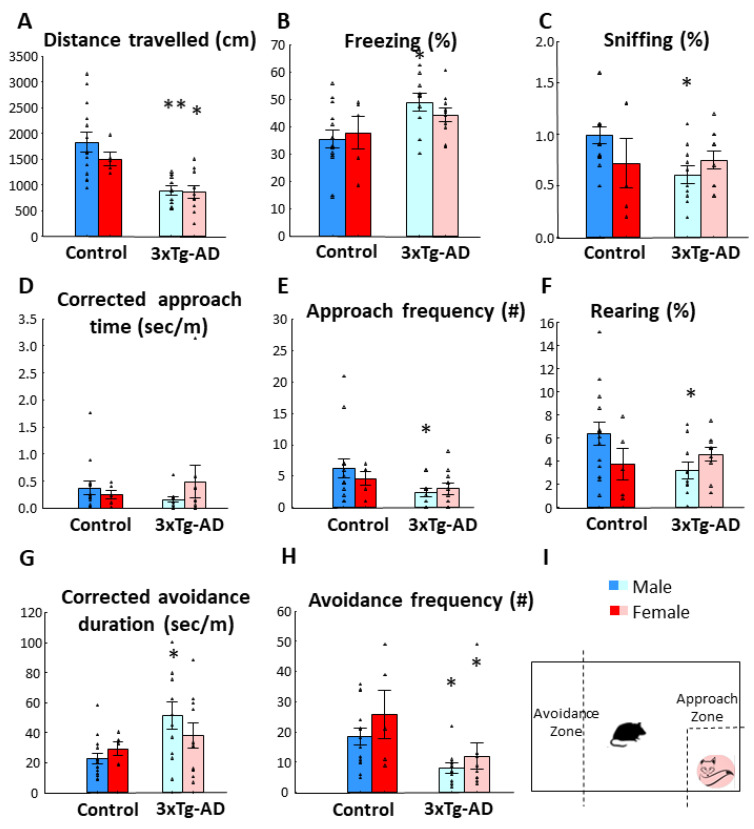
Figure 2.
Fox odor avoidance behavior in 2-month-old male and female animals. (A) Distance traveled in centimeters during 10 min. The 3xTg-AD moved significantly less than the controls (p < 0.01) without sex difference. (B) Time spent freezing in percentage of 10 min observation period. The 3xTg-AD animals displayed increased freezing time (p < 0.01). (C) Time spent sniffing on the fox odor container. No statistical significance was observed in genotype or sex. (D) Corrected approach time to fox odor zone. No statistical significance was observed in genotype or sex. (E) Frequency in which the animals approached the odor zone. The 3xTg-AD group displayed lower frequency than the control group (p < 0.05). (F) Time spent rearing in percentage of 10 min observation period. No statistical significance was observed in genotype or sex. (G) Corrected avoidance duration. The 3xTg-AD animals spent more time in the avoidance zone than their age matched controls (p < 0.01). (H) Number of entries into the avoidance zone. As 3xTg-AD animals spent more time in the avoidance zone, they entered less often (p < 0.01). No main sex effect or genotype x sex interaction were observed in any of the presented parameters. (I) Schematic representation of the fox odor test. Data are shown as the mean ± SEM. The individual raw data points are represented as triangles. * p < 0.05, ** p < 0.01 vs. Control. # = amount of approach and/or avoidance frequency.

