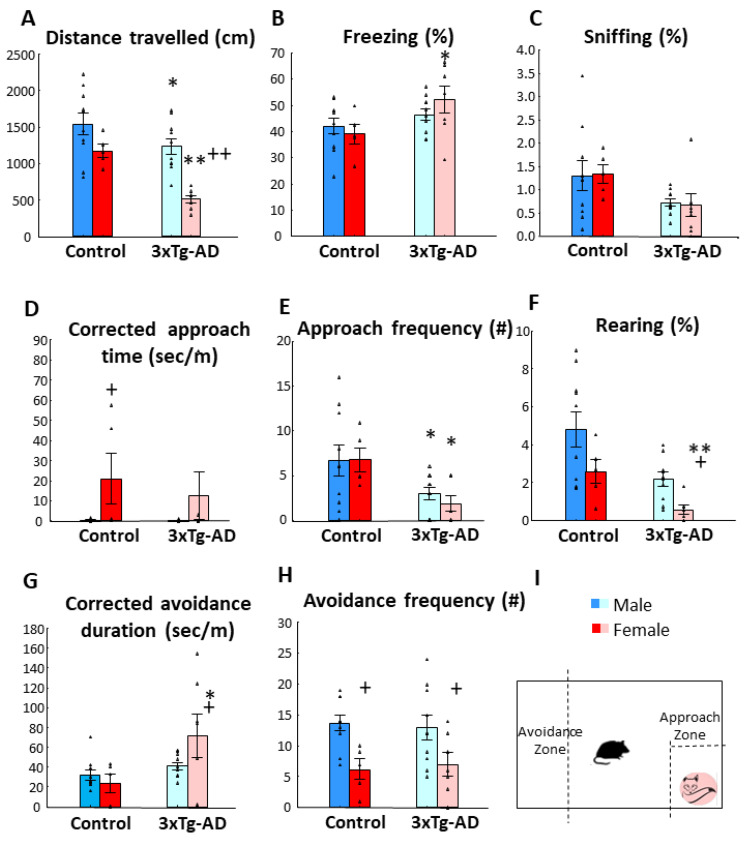
Figure 3.
Fox odor avoidance behavior in 15-month-old male and female animals. (A) Distance traveled in centimeters during 10 min. The 3xTg-AD moved significantly less than the control group (p < 0.01). Additionally, the female moved less (p < 0.01) compared to males irrespective from their genotype. (B) Time spent freezing in percentage of 10 min observation period. The 3xTg-AD animals displayed increased freezing (p < 0.05). (C) Time spent sniffing on the fox odor container. The 3xTg-AD animals spent less time sniffing (p < 0.01) without sex difference. (D) Corrected approach time to fox odor zone. The female animals investigated the approached zone longer than males (p < 0.05). (E) Number of approaches to the odor zone. The 3xTg-AD group displayed lower frequency than the control group (p < 0.05). (F) Rearing activity. The 3xTg-AD reared less than controls (p < 0.05). (G) Corrected time spent in the avoidance zone. The 3xTg-AD animals spent more time in the avoidance zone than their age matched controls (p = 0.01). (H) Number of entries into the avoidance zone. The female animals entered into the avoidance zone less often (p = 0.01). No significant genotype x sex interaction was observed in any of the investigated parameters. (I) Schematic representation of the fox odor test. Data are shown as the mean ± SEM. The individual raw data points are represented as triangles. * p < 0.05, ** p < 0.01 vs. Control; + p < 0.05, ++ p < 0.01 vs. Male. # = amount of approach and/or avoidance frequency.

