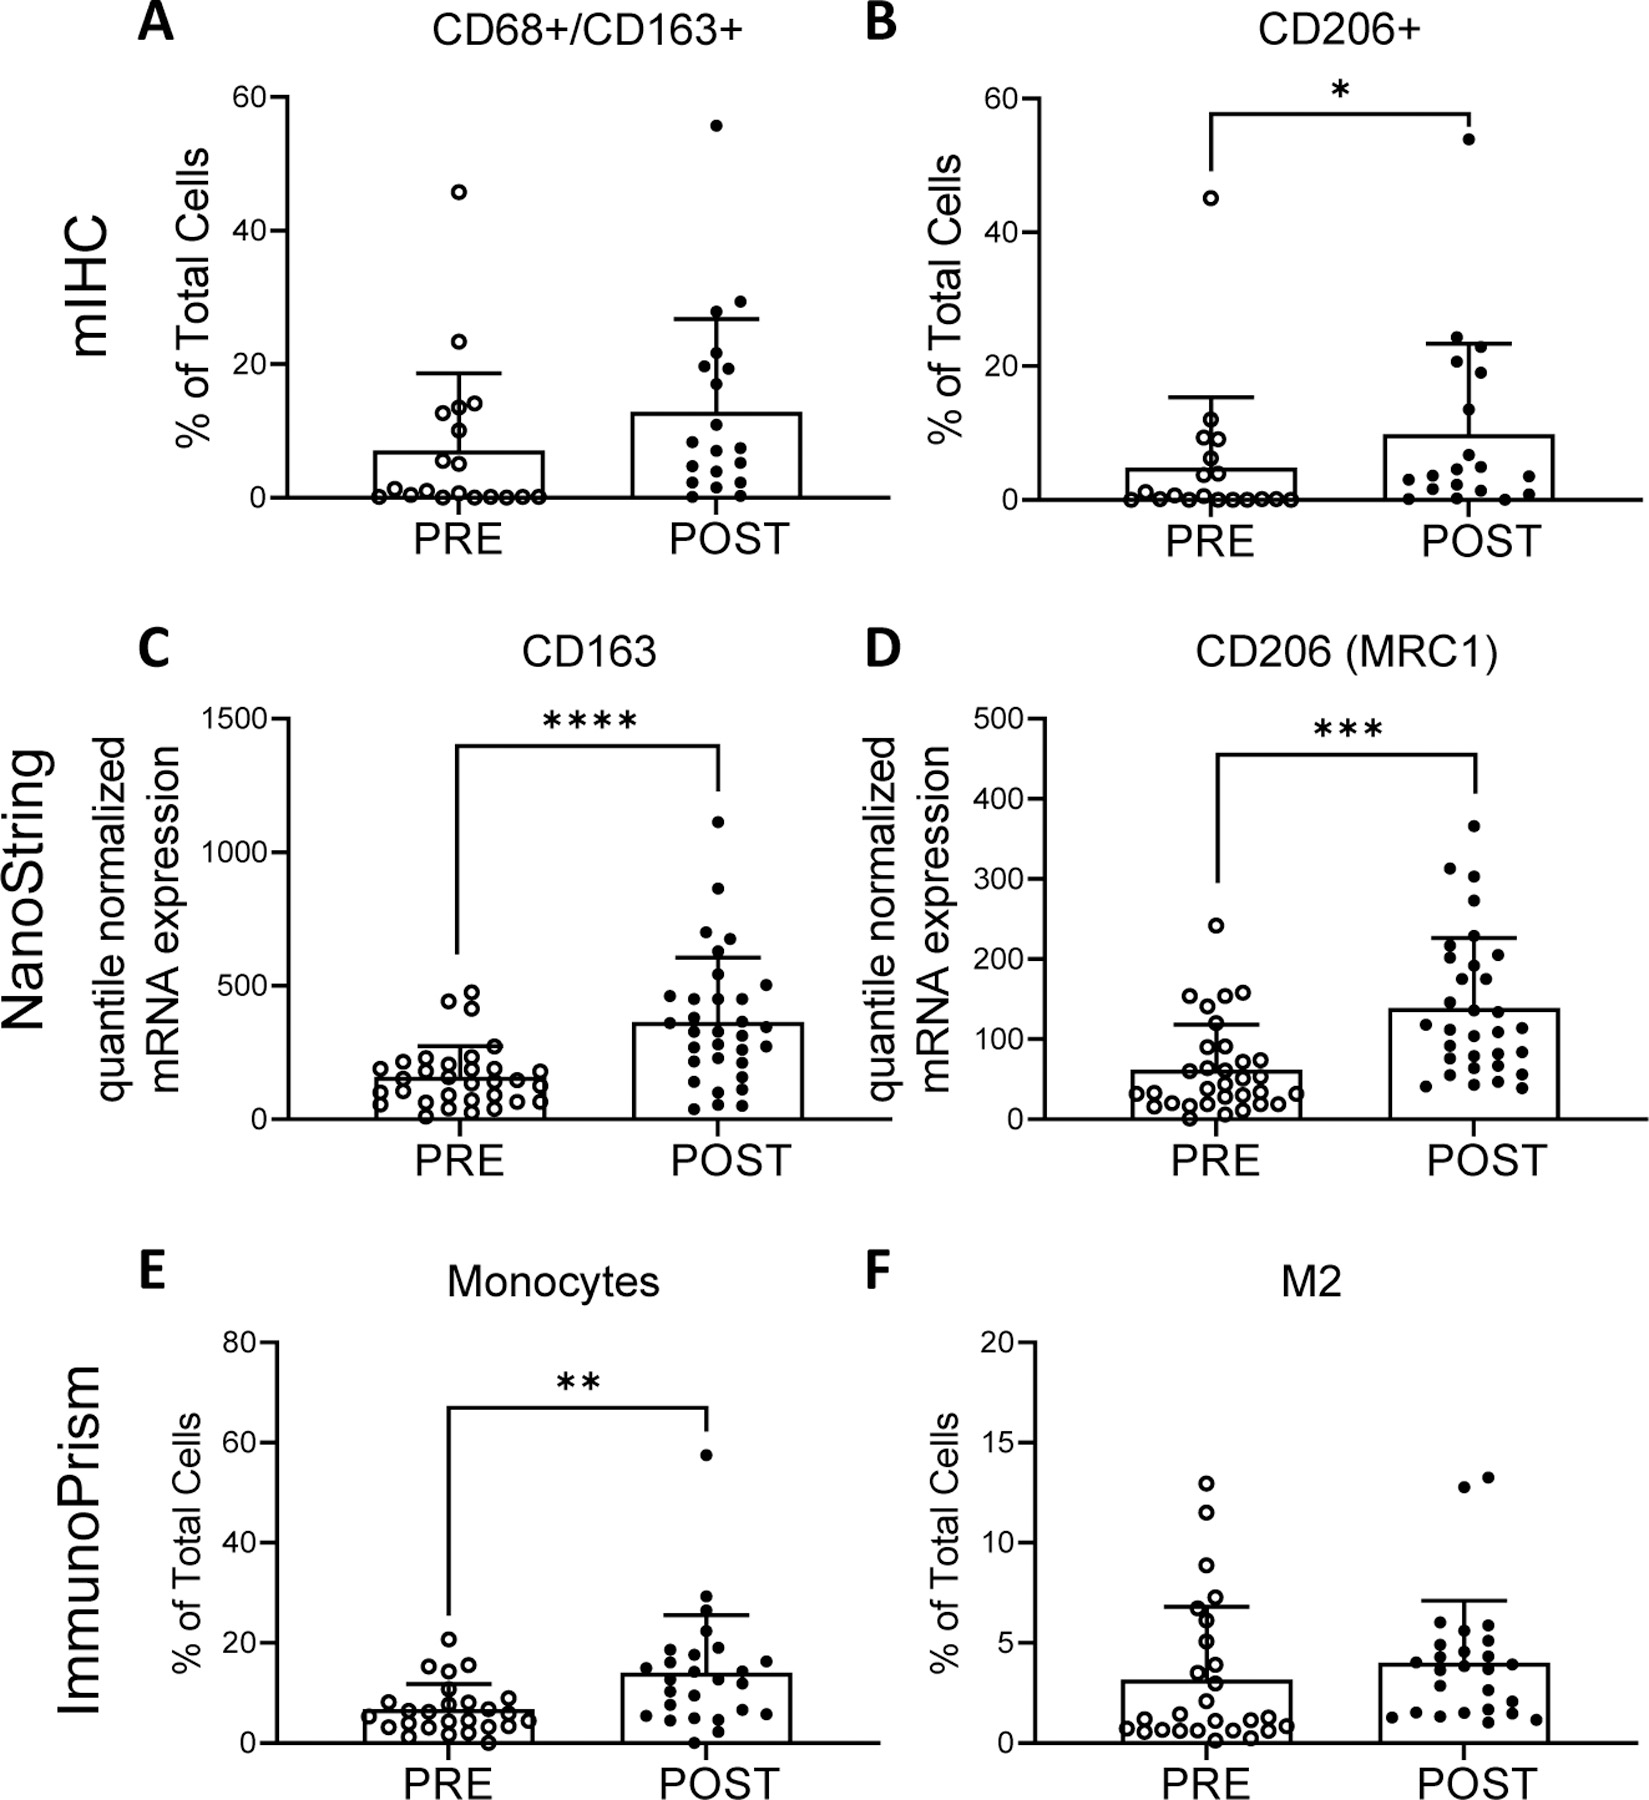
Figure 3.

Myeloid cells pre- and post- neoadjuvant therapy identified by multiplex immunohistochemistry (mIHC) (top row), NanoString quantile normalized mRNA expression (middle row), and RNA sequencing with analysis by ImmunoPrism (bottom row). mIHC: percentage of CD68+/CD163+ cells (A) and CD206+ as percentage of total cells (B). NanoString: quantile normalized expression values for CD163 (C) and CD206 (MRC1) (D) genes. ImmunoPrism: percentage of monocytes (E) and M2 macrophages (F). Individual values, mean and standard deviations are shown. mIHC and ImmunoPrism statistical differences were tested using two-tailed paired t-tests: * p-value <0.05, ** p-value <0.01. NanoString: differences were tested with paired t-tests with Benjamini-Hochberg adjusted p-values (q-values). *** q-value < 0.001, **** q-value <0.0001.
