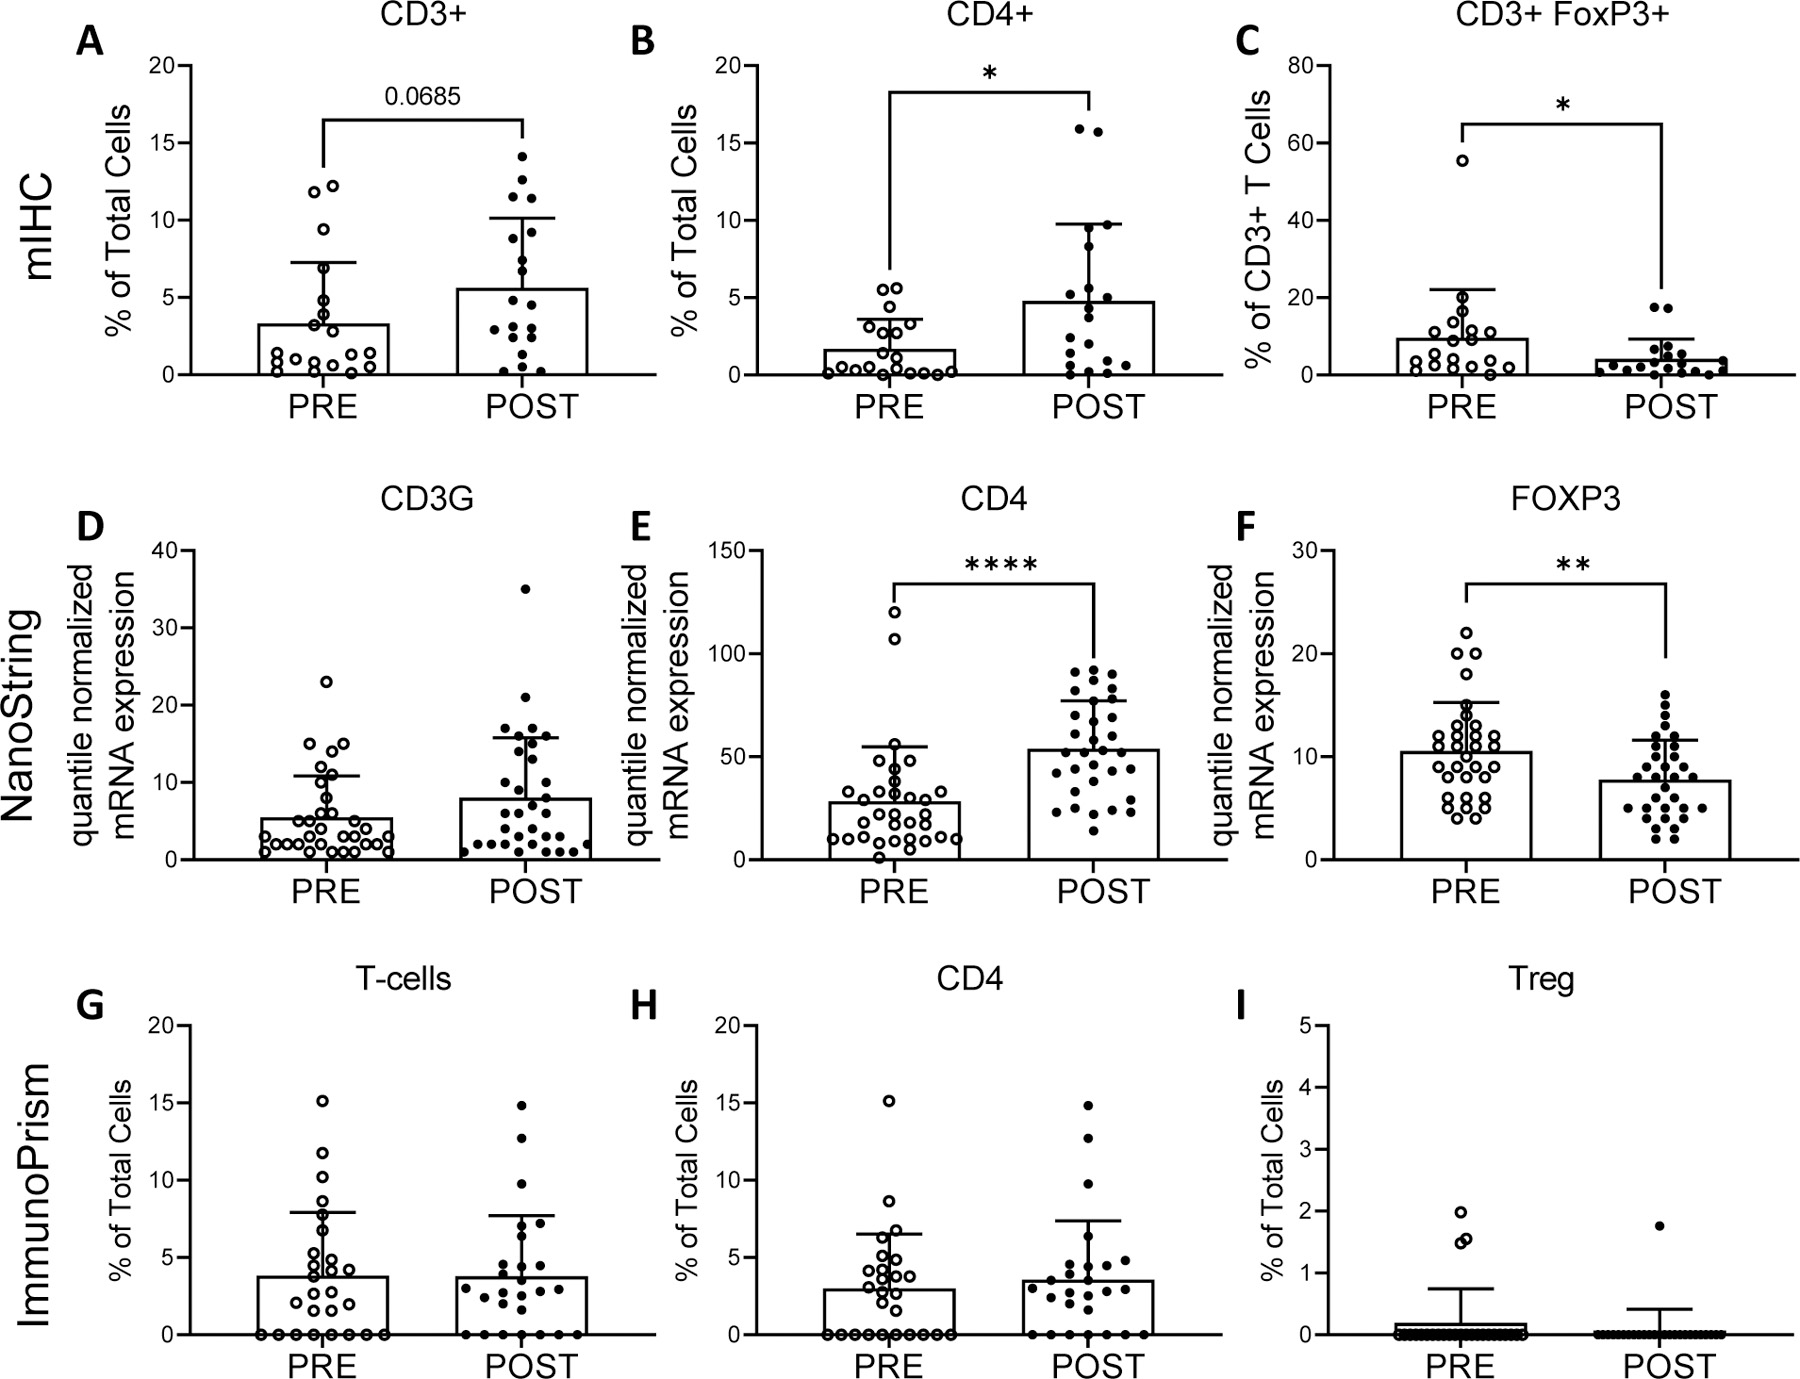
Figure 4.

Tumor infiltrating T cells pre- and post- neoadjuvant therapy identified by mIHC (top row), NanoString quantile normalized mRNA expression (middle row), and RNA sequencing with analysis by ImmunoPrism (bottom row). mIHC: percentage of CD3+ cells (A), CD4+ cells (B) and FOXP3+ T cells (C). NanoString: quantile normalized expression values for CD3G (D), CD4 (E) and FOXP3 (F) genes. ImmunoPrism: percentage of T cells (CD3) (G), CD4 cells (H) and T regulatory cells (Treg) (I). Individual values, mean and standard deviations are shown. mIHC and ImmunoPrism statistical differences were tested using two-tailed paired t-tests: * p-value <0.05. Nanostring: differences were tested with paired t-tests with Benjamini-Hochberg adjusted p-values (q-values). ** q-value < 0.01, **** q-value <0.0001.
