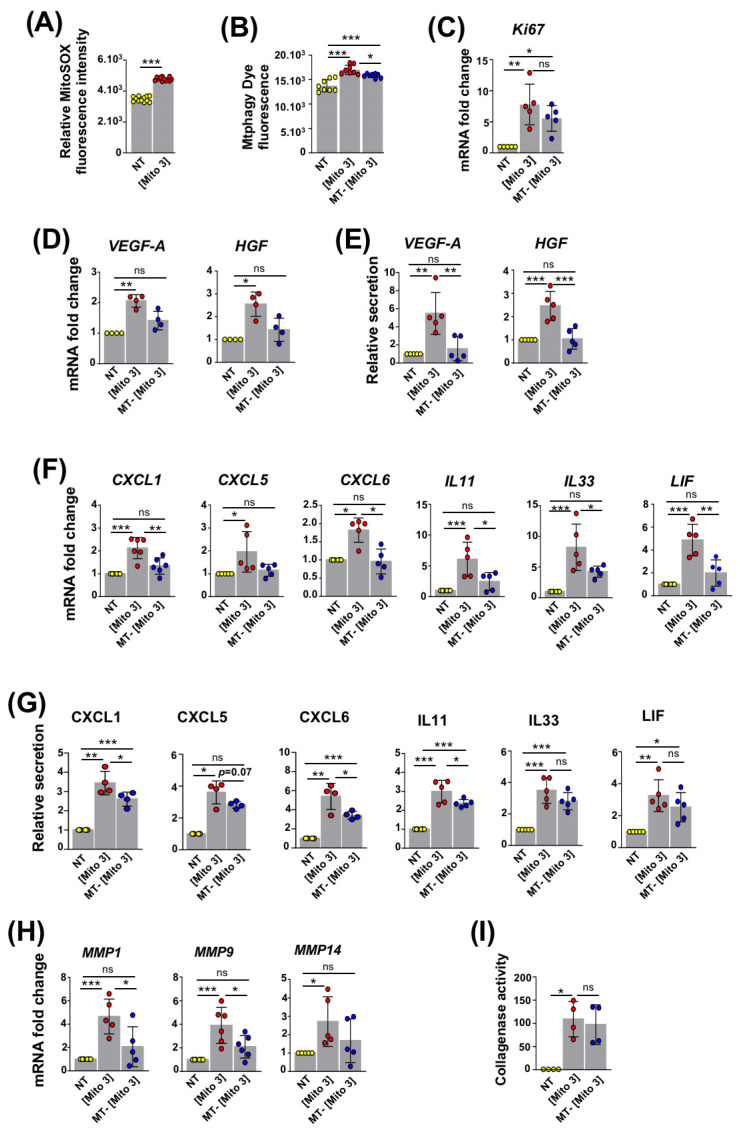
Figure 4.
ROS from cardiac mitochondria trigger the mitophagy-dependent activation of MSCs. (A) MitoSOX fluorescence in MSCs following exposure to cardiac mitochondria (the Mito 3 concentration) (n = 12). (B–I) MSCs were exposed to cardiac mitochondria (the Mito 3 concentration) previously treated with mitoTEMPO (MT) or not and compared with non-treated MSCs (NT). (B) Mtphagy fluorescence (n = 8). (C) Relative mRNA expression (n = 5). (D) Relative mRNA (n = 4) and (E) protein secretion (n = 5) levels of VEGF-A and HGF. (F) Relative mRNA (n ≥ 5) and (G) protein secretion (n = 4) levels of CXCL1, CXCL5, CXCL6, IL11, IL33 and LIF. (H) Relative mRNA expression of MMP1, MMP9 and MMP14 (n ≥ 5). (I) Relative collagenase activity (n = 4). Unpaired Student’s t-test in (A). One-way ANOVA with Tukey’s multiple comparisons test in (B,C,E,F,H). One-way ANOVA with Dunn’s multiple comparisons test in (D,G,I). * p < 0.05, ** p < 0.01, *** p < 0.001. Each dot represents an independent experiment. Bar graphs represent mean values ± SD.

