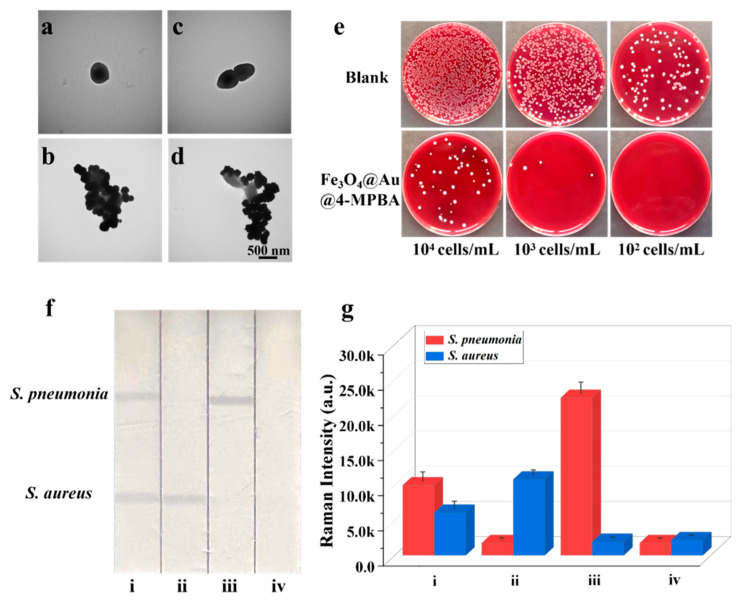
Figure 2.
TEM images of (a) S. aureus, (b) S. aureus captured by Fe3O4@Au/DTNB/Au/4-MPBA, (c) S. pneumonia, and (d) S. pneumonia captured by Fe3O4@Au/DTNB/Au/4-MPBA. (e) Photographs of bacteria capture, the colonies on blood agar plates represent the amounts of remaining S. aureus and S. pneumonia in the supernatant after being captured by Fe3O4@Au/DTNB/Au/4-MPBA MNPs, the concentrations of bacteria ranged from 104 cells mL−1 to 102 cells mL−1. (f) Images and (g) corresponding SERS intensities of Fe3O4@Au/DTNB/Au/4-MPBA-LFA with different concentrations of S. aureus and S. pneumonia: (i) 105, 105 cells mL−1; (ii) 105, 0 cells mL−1; (iii) 0, 105 cells mL−1; and (iv) 0, 0 mL−1.

