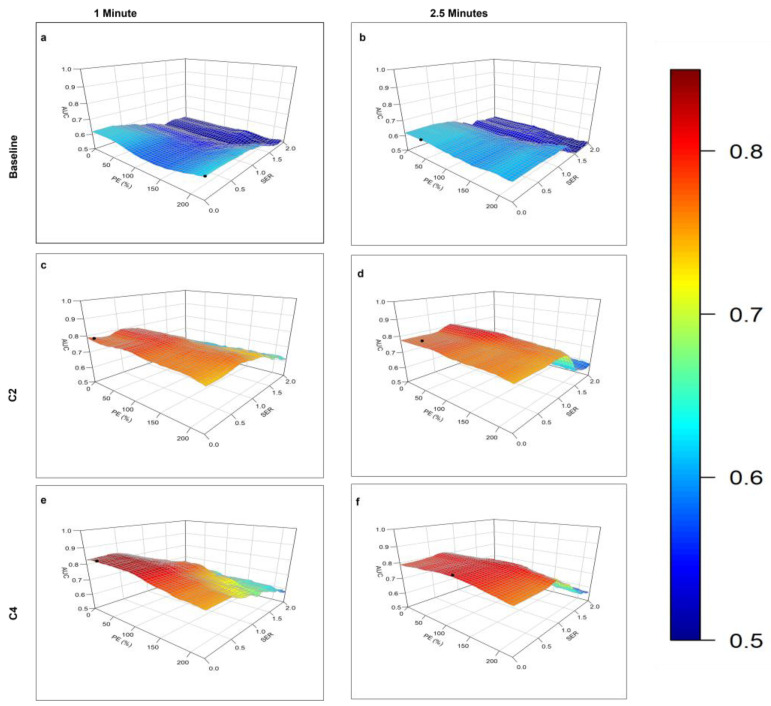
Figure 3.
Plots of the area under the receiver operating characteristic curve (AUC) for response prediction as a function of the percentage enhancement (PE) and signal enhancement ratio (SER) used to calculate the functional tumor volume on DCE MRI images obtained (a,b) at baseline, 1 min (a), and 2.5 min (b) after contrast agent injection; (c,d) after 2 cycles of neoadjuvant systemic therapy (NAST), at 1 min (c), and 2.5 min (d) after contrast agent injection; and (e,f) after 4 cycles of NAST, at 1 min (e), and 2.5 min (f) after contrast agent injection. In each case, the PE–SER combination with maximum AUC (black circle) was selected as the optimal threshold.

