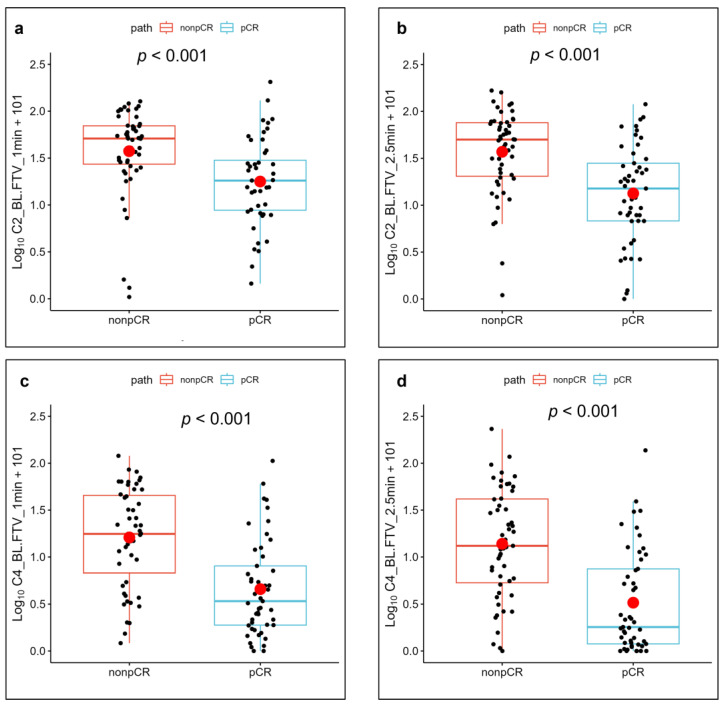
Figure 6.
Relative changes in the functional tumor volume (FTV) measurements and their mean (red circle) corresponding to optimal percentage enhancement (PE) and signal enhancement ratio (SER) for patients with pathologic complete response (pCR) and non-pCR. Plots correspond to (a,b) changes in FTV from baseline (BL) to after the second cycle of neoadjuvant systemic therapy (NAST) (C2), measured on images obtained 1 min (a) and 2.5 min (b) after contrast agent injection; and (c,d) changes in FTV from baseline to after the fourth cycle of NAST (C4), measured on images obtained 1 min (c) and 2.5 min (d) after contrast agent injection.

