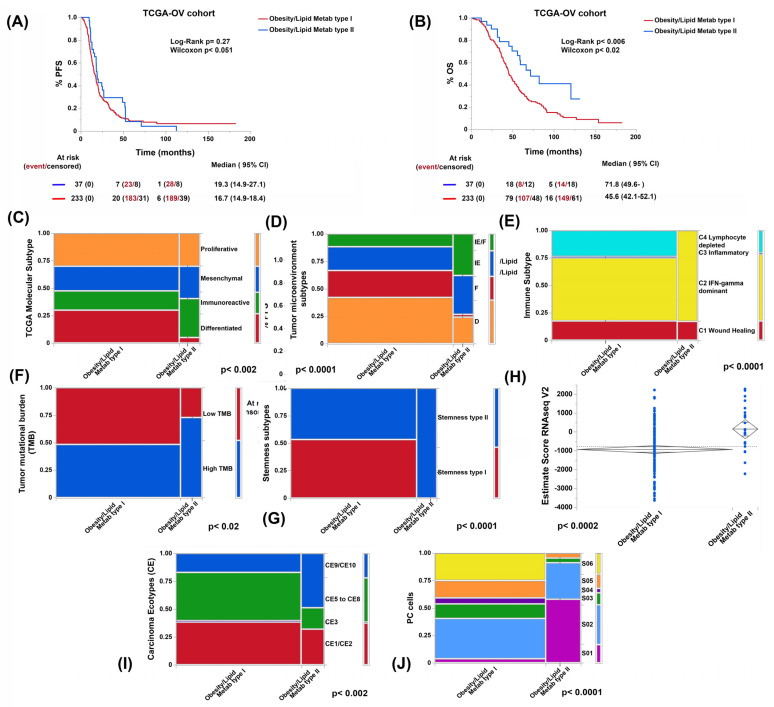
Figure 4.
Comparative progression-free (PFS; A) and overall survival (OS; B) curves, prevalence of different TCGA-OV molecular subtypes (C), tumor microenvironment (TME) subtypes (desert [D], fibrotic [F], immune-enriched non-fibrotic [IE], and immune-enriched fibrotic [IE/F]; (D), immune subtypes (E), tumor mutation burden level (TMB; F), stemness subtype (G), ESTIMATE score (H), and prevalence of carcinoma ecotypes (CE, I) and plasma cell (PC) states (S, J) according to obesity and lipid metabolism clustering using RNA-seq data from the TCGA-OV cohort.

