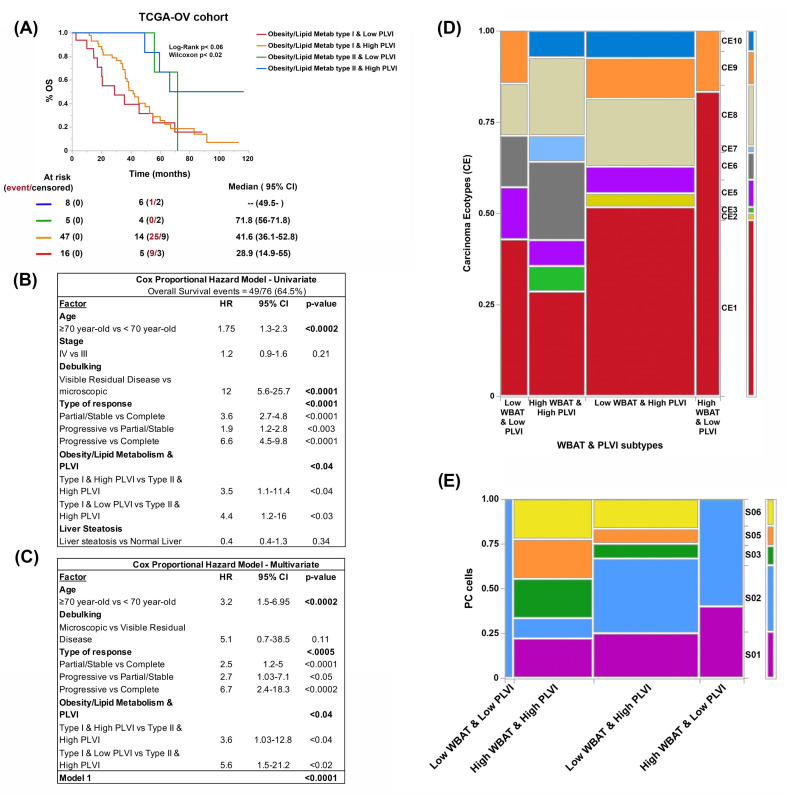
Figure 5.
Overall survival (OS, A) curve and univariate (B) and multivariate (C) Cox proportional hazard regression analyses based on BC estimated using obesity and lipid metabolism clustering and central sarcopenia (PLVI, A and tables below it). Prevalence of different carcinoma ecotypes (CE) and plasma cell (PC) states (S) according to BC types (using VAT/SCAT and PLVI, D,E) in the TCGA-OV cohort.

