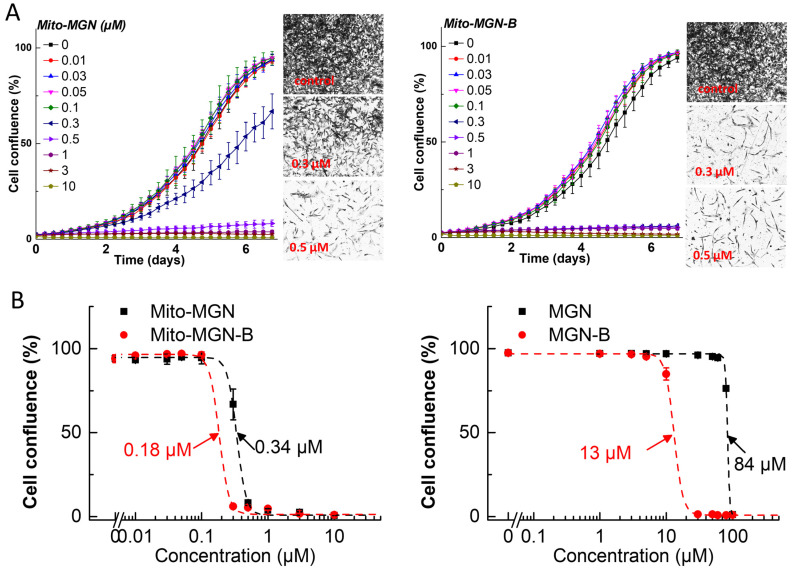
Figure 4.
Effects of Mito-MGN, Mito-MGN-B, MGN, and MGN-B on the proliferation of glioblastoma cancer (U87MG) cells. The effects of Mito-MGN, Mito-MGN-B, MGN, and MGN-B on the proliferation of U87MG cells were monitored in the IncuCyte Live-Cell Analysis system. The IncuCyte analyzer provides real-time updates on cell confluence based on segmentation of high definition-phase contrast images. Representative cell images are shown as segmentation masks, illustrated in black when control cells reached 90% confluence. Full growth curves of Mito-MGN and Mito-MGN-B are shown in panel (A). The IC50 values were determined at the point at which control cells reached ~90% confluence. Relative cell confluence (control is taken as 100%) is plotted against concentration. Dashed lines represent the fitting curves used to determine the IC50 values as indicated for Mito-MGN and Mito-MGN-B in panel (B, left) for MGN and MGN-B in panel (B, right). Data shown are the mean ± SD.

