Figure 4.
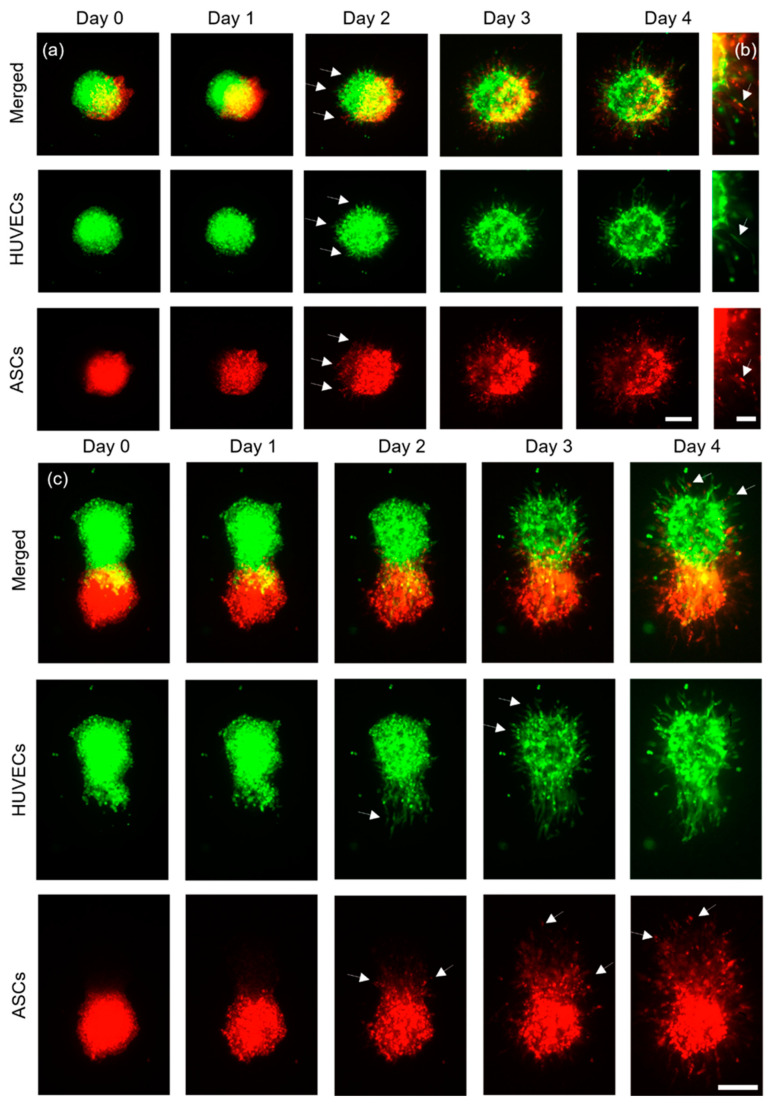
Representative images of ASCs stained with CellTrackerTM red, and HUVECs stained with CellTrackerTM green. (a) Aggregates printed with a full overlap (scale bar: 200 μm) were imaged for four days and (b) developed joint structures containing both cell types in the same structure (scale bar: 100 μm). (c) ASCs and HUVECs printed with a partial overlap are shown (scale bar: 200 μm).

