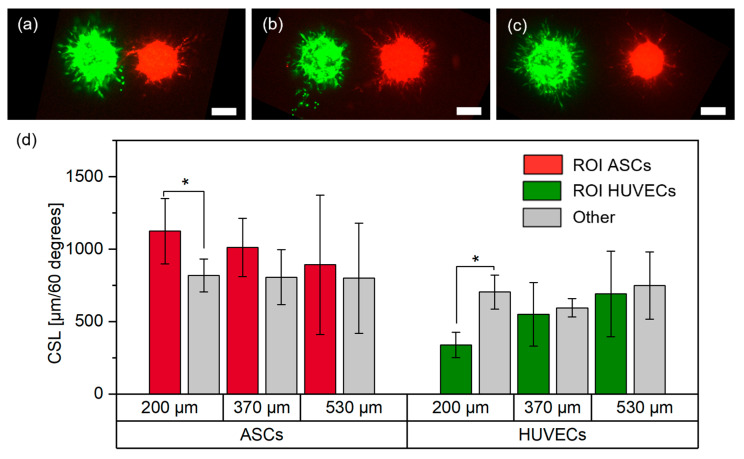
Figure 5.
Representative images of ASCs stained with CellTrackerTM red, and HUVECs stained with CellTrackerTM green, in the (a) 200 μm, (b) 370 μm and (c) 530 μm group on day three (scale bar: 200 μm), and (d) respective measurements of the cumulative sprout(-like) lengths (CSLs) on day three; *, p < 0.05 using a paired Student’s t-test.

