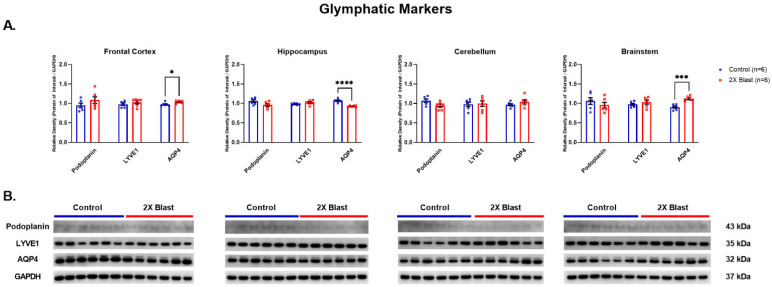
Figure 2.
Glymphatic related protein expression changes. (A) Densitometric ratio of the levels of Podoplanin, LYVE1, and AQP4 with respect to GAPDH as measured in the FCtx, H, CRB and BS 15 days following an explosive-driven double blast exposure, n = 6 per group, * indicates p values < 0.05, *** indicates p values < 0.001 and **** indicates p values < 0.0001, as determined by 2-tailed, unpaired t-tests. Error bars represent standard error of the mean (SEM). (B) Representative western blots # for each antibody used. All gels were run in triplicate and data represents the average of 3 runs per sample. # For full length blots, see Supplementary Figures S5–S7.

