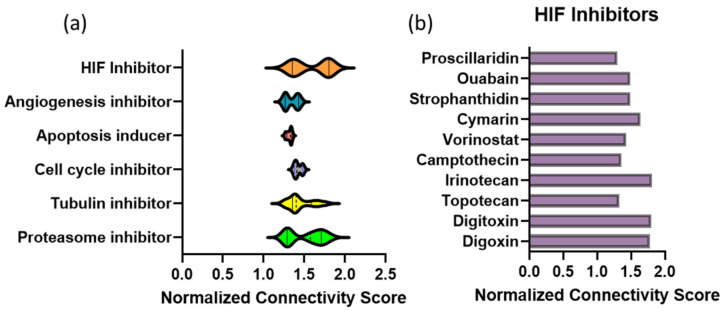
Figure 1.
Connectivity map analysis of transcriptional profile changes caused by MBZ treatment uncovers a novel link to hypoxia-inducible factor (HIF) inhibitors. (a) CLUE query from the Broad Institute. Normalized connectivity scores of inhibitors and inducers based on the top 100 differentially expressed genes decreased in both MDA-MB-231 and SUM159 cells treated with MBZ in vitro based on RNA sequencing data. Violin plot of highest connectivity score for the classes of perturbations indicated. Proteasome inhibitors (n = 14), cell cycle inhibitors (n = 3), apoptosis inducers (n = 5), angiogenesis inhibitors (n = 4), HIF-1α inhibitors (n = 6), and tubulin inhibitors (n = 17). (b) Bar graph of specific normalized connectivity scores for HIF-1α inhibitors shown in (a).

