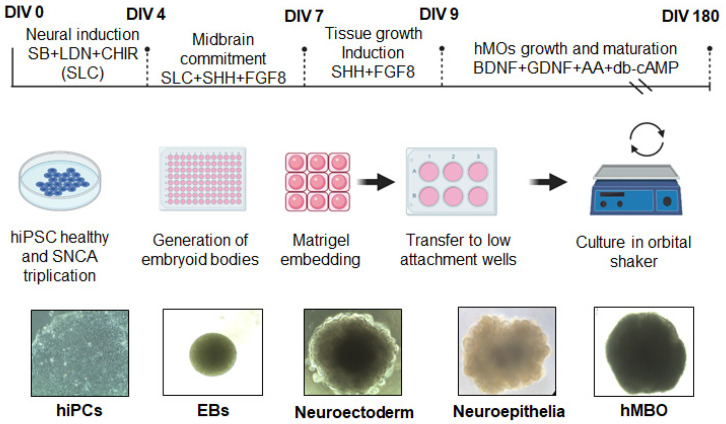
Figure 1.
Schematic description of the protocol to generate hMBOs. Schematic diagram illustrating the protocol to generate hMBOs and representative brightfield images of hMBOs at different stages of differentiation. The scale bar for image DIV 0 is 100µm, DIV4 and DIV7 is 260 µm and for images, DIV 11 and DIV30 is 520 µm.

