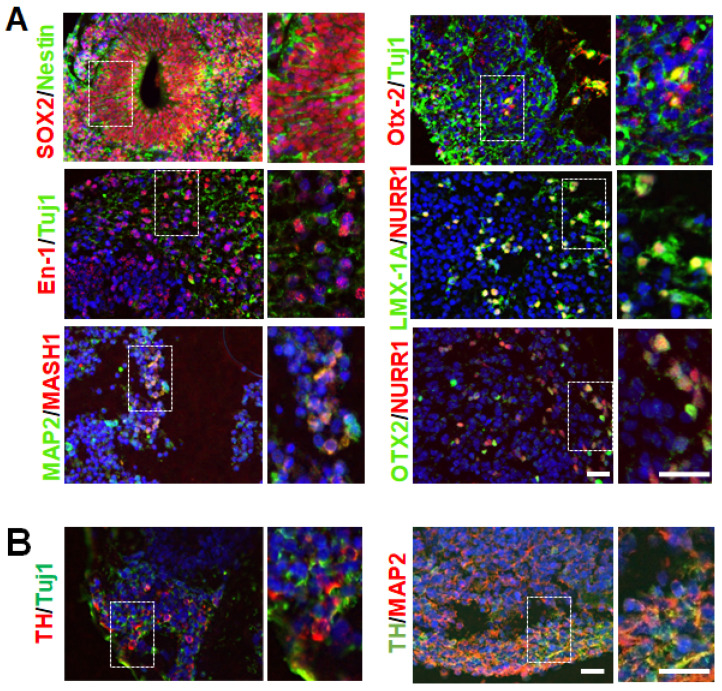
Figure 2.
Generation and characterization of hMBOs from hiPSCs. (A). Representative immunostaining images of hMBOs characterization at 30 DIV using neuroepithelial markers (SOX2, Nestin), dorsal midbrain and DA progenitor markers (Otx2, En-1, LMX-1A, NURR1 and MASH1). (B). Representative immunostaining images using DA neuron marker TH with a pan-neuronal marker Tuj1 and postmitotic neuronal marker MAP2. All slides were counterstained with DAPI (blue) to mark nucleus. Dotted squares represent the magnified areas shown on the right side of the main image. The scale bar is 50 µm.

