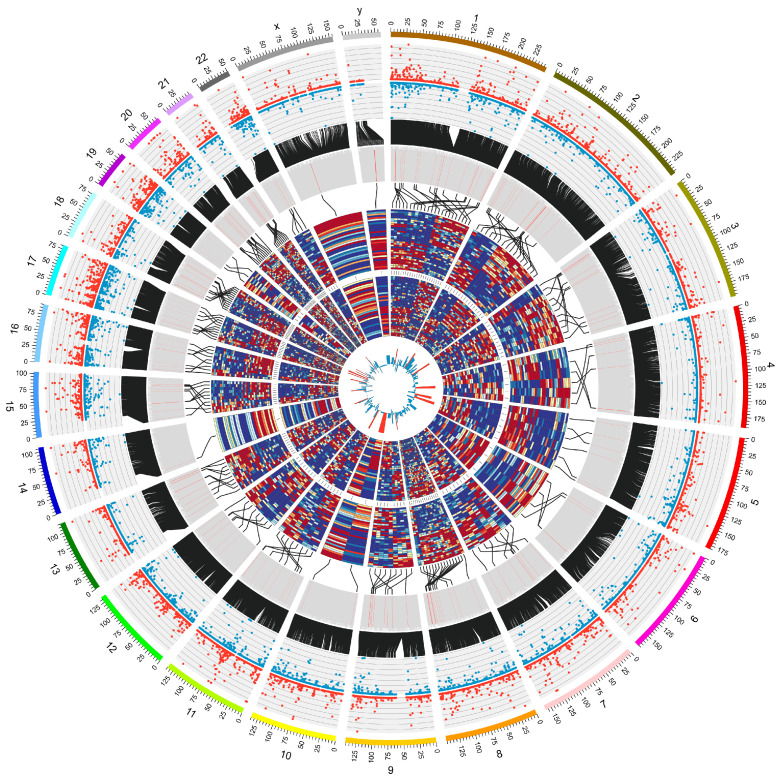
Figure 2.
Circos plot displayed screening of metastasis-related lncRNAs in FUSCC RNA sequence data. Circos plot displayed the distribution and expression of lncRNAs on human chromosomes. The outermost layer was a chromosome map of the human genome. The inner scatter diagrams corresponded to the distribution and expression of detected lncRNAs on the chromosomes; the red represents tumor tissue, while the blue represents normal tissue. The next inner histogram corresponded to the p-value for the differential expression analysis between tumor tissue and normal tissue, and the first 200 p-values were marked red. The next inner heat map from outside to inside corresponded to the expression of the first 200 lncRNAs in tumor tissue of HMG, normal tissue of HMG, tumor tissue of LMG, and normal tissue of LMG. The innermost histogram corresponded the expression ratio between HMG and LMG; ratios > 2 were marked red; and LINC01094 was represented by the red column, pointing to chromosome 4.

