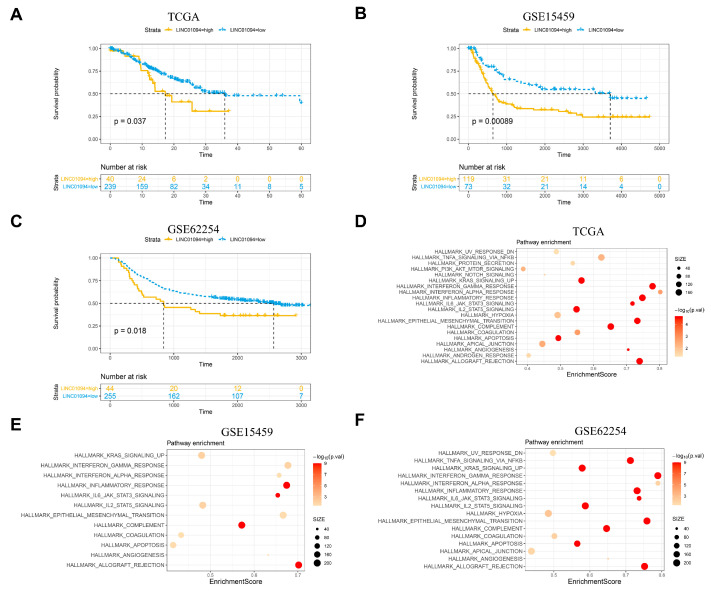
Figure 3.
Survival and GSEA analysis in TCGA and GEO data sets. Kaplan–Meier survival plot showed that LINC01094 high-expression gastric cancer (separated by cutoff expression of LINC01094 calculated by ROC analyses) conferred a worse prognosis in the TCGA gastric cancer (A), GSE15459 (B), and GSE62254 (C) cohorts. Upregulated pathways analyzed by GSEA in TCGA gastric cancer cohort (D), GSE15459 (E), and GSE62254 (F).

