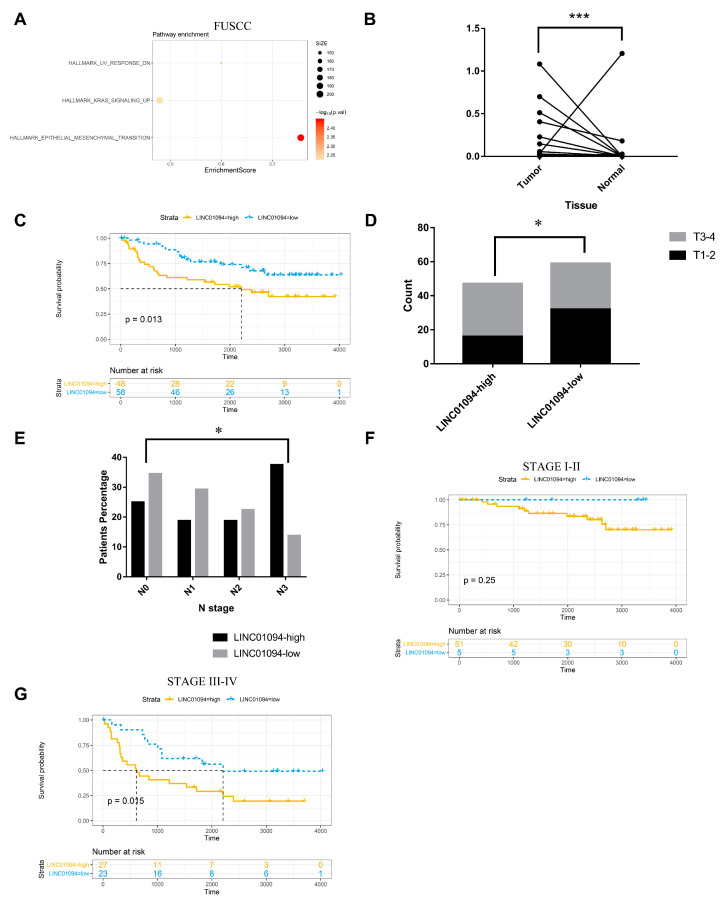
Figure 4.
Analysis in FUSCC RNA sequence and PCR data. (A) Upregulated pathways analyzed by GSEA in FUSCC RNA sequence data. (B) LINC01094 expression was evaluated in 106 paired cancerous and noncancerous tissues from FUSCC. (C) For the whole cohort, the Kaplan–Meier curve showed that LINC01094 high expression was associated with an unfavorable prognosis. Patients in the LINC01094 high-expression group had higher T (D) and N (E) stages. (F) For the stage I–II subgroup, the Kaplan–Meier curve showed that LINC01094 high expression was associated with an unfavorable prognosis. (G) For the stage III–IV subgroup, the Kaplan–Meier curve showed that LINC01094 high expression was associated with an unfavorable prognosis. *: p < 0.01, ***: p < 0.001.

