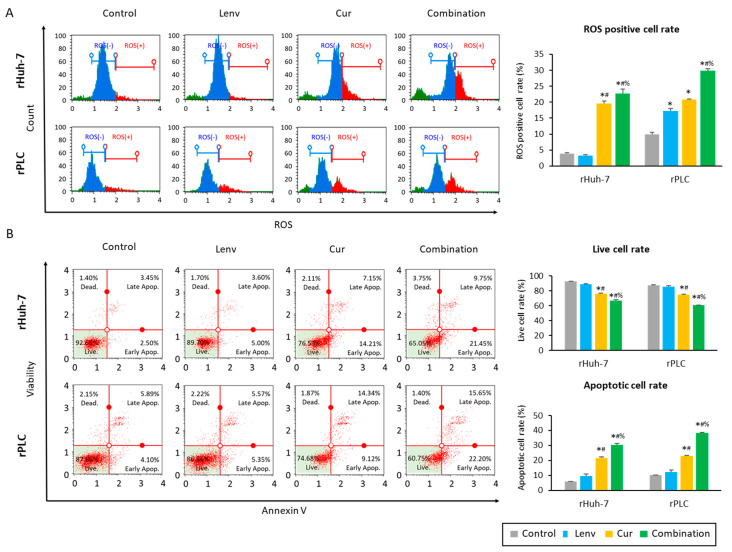
Figure 4.
Co-administration of Curcumin with Lenvatinib induced cellular apoptosis via intracellular accumulation of ROS. (A) Representative images of oxidase stress assay following treatment in Lenvatinib-resistant cells (*: p < 0.05 vs. control, #: p < 0.05 vs. Lenvatinib, %: p < 0.05 vs. Curcumin). (B) Representative images of annexin-V assays. Graphs indicate the percentages of live and apoptotic cells (*: p < 0.05 vs. control, #: p < 0.05 vs. Lenvatinib, %: p < 0.05 vs. Curcumin). The data indicate mean (column) ± SD values. ROS, reactive oxygen species; SD, standard deviation.

