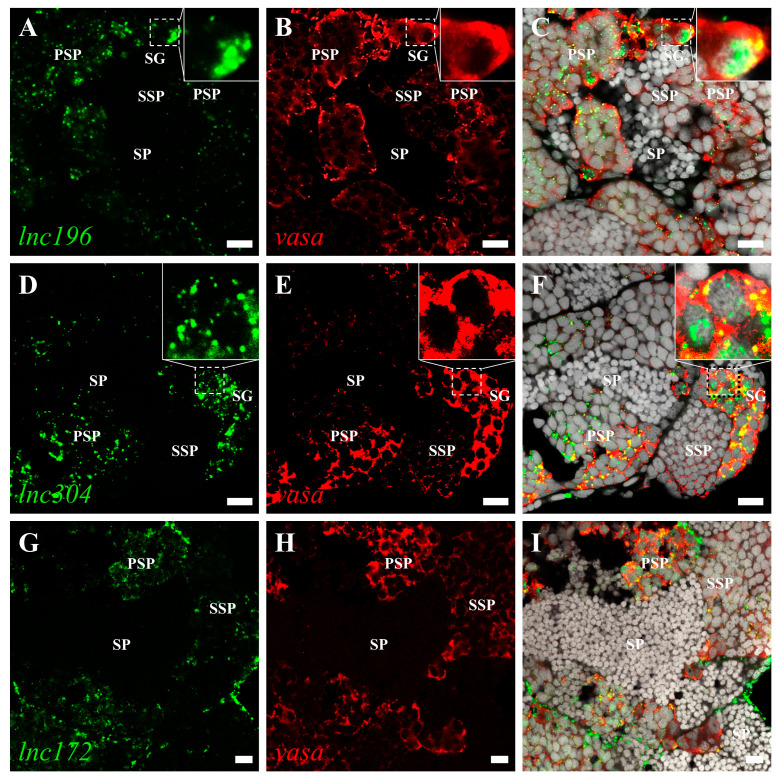
Figure 5.
Double color fluorescent analysis of lncRNAs and vasa protein in zebrafish testes. The signals of lnc196 (A), lnc304 (D), and lnc172 (G) are shown in green, and vasa signals (B,E,H) are indicated in red. (C,F,I) The merged images and magnified images are shown in the boxes within panel C and F. SG: spermatogonia, PSP: primary spermatocyte, SSP: secondary spermatocyte and SP: spermatid. Scale bar:10 μm.

