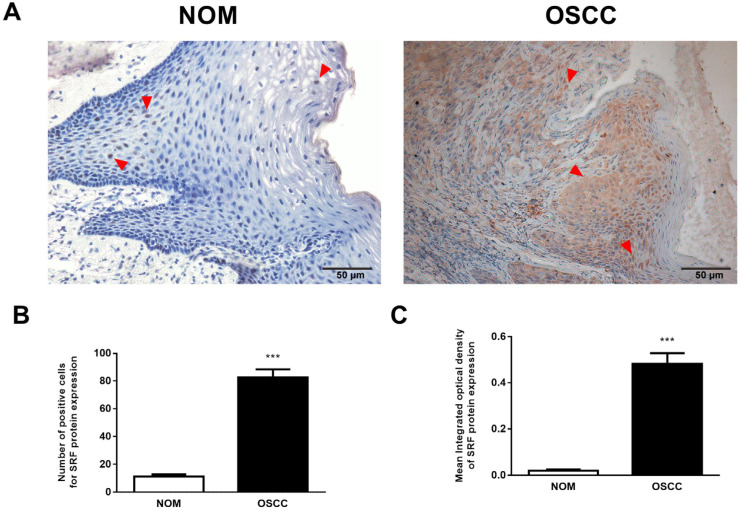
Figure 1.
SRF is upregulated in human OSCC tissues. (A,B) Representative immunohistochemical images of SRF expression in NOM (A) and OSCC (B) tissues. representative staining of SRF marked by read triangle. Statistical analysis of proportions of SRF (C) positive cells and (D) staining intensity in OSCC and NOM tissues. Scale bar, 50 μm. *** p < 0.001 (Student t-tests vs. NOM). Scale bar: 50 μm. NOM, normal oral mucosa; OSCC, oral squamous cell carcinoma; SRF, serum response factor.

