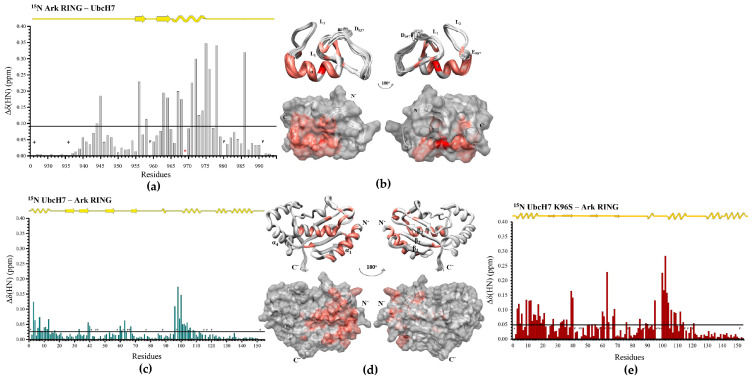
Figure 3.
Interaction of E3 Arkadia with wt UbcH7 and UbcH7 K96S mutant. (a) Diagram of the total CSPs measured at a 1:2 molar ratio (saturation point) for 15N Ark RING/14N wt UbcH7, *: represents disappeared residues, +: represents residues with no information. (b) Ark RING mapping (PDBid: 2KIZ) after the addition of UbcH7 (residues that disappeared during the interaction are colored red, whereas residues that exhibited ‘fast exchange’ interaction are colored coral). (c) Diagram of the total CSPs measured at a 1:1.5 molar ratio for 15N UbcH7/14N Ark RING. (d) UbcH7 mapping (PDBid: 6XXU) after the addition of Ark RING. (e) Diagram of the total CSPs measured at a 1:1.5 molar ratio for 15N UbcH7 K96S/14N Ark RING. (f) ITC data for the titration of wt UbcH7 into Ark RING and (g) UbcH7 K96S into Ark RING. (h) In vitro auto-ubiquitylation assays of Ark LONG using wt UbcH7 and UbcH7 K96S, respectively.


