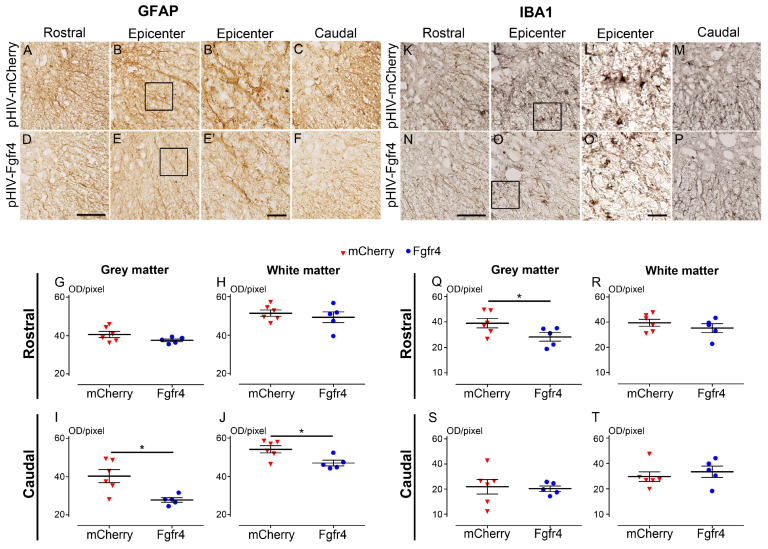
Figure 6.
pHIV-Fgfr4 vector injection immediately after SCI reduces astrocyte reactivity caudal to the lesion. Glial reactivity was assessed using peroxidase immunohistochemistry for astrocyte (GFAP; A–F,B’,E’), and microglia (IBA1; K–P,L’,O’). Brightfield micrographs of GFAP in the injured spinal cords of mice injected with the control vector (A–C) or the experimental vector (D–F). Micrographs were taken at the lesion epicenter on the contralateral side (B,E), rostral (A,D), and caudal (C,F) to the lesion site. Zoomed-in micrographs taken in the lesion site of the control (B’) and the experimental (E’) group (black insets in (B) and (E), respectively). Quantifications of GFAP expression were performed rostral (G,H) and caudal (I,J) to the lesion site in the grey (G,I) and the white matters (H,J). Immunoperoxidase staining for IBA1 (K–P) was performed in the injured spinal cords of mice injected with the control vector (K–M) or the experimental vector (N–P). Micrographs were taken at the lesion epicenter on the contralateral side of the lesion (L,O), rostral (K,N), and caudal (M,P) to the lesion site. Zoomed-in micrographs taken in the lesion site of the control (L’) and the experimental (O’) group (black insets in L and O, respectively). Quantifications of IBA1 expression were performed rostral (Q,R), and caudal (S,T) to the lesion site in the grey (Q,S), and the white matters (R,T). In all graphs, data from animals that received the experimental vector (blue), and the control vector (red) are represented. Data are expressed as mean per mouse ± SEM. Student’s unpaired t with Welch’s correction * p ≤ 0.05. Number of C57BL6/6J female mice: 5 pHIV-Fgfr4 and 6 pHIV-mCherry. Analyses were performed at 6 weeks after SCI. Scale bars: 100 µm (A–F,K–P) and 25 µm (B’,E’–L’,O’).

