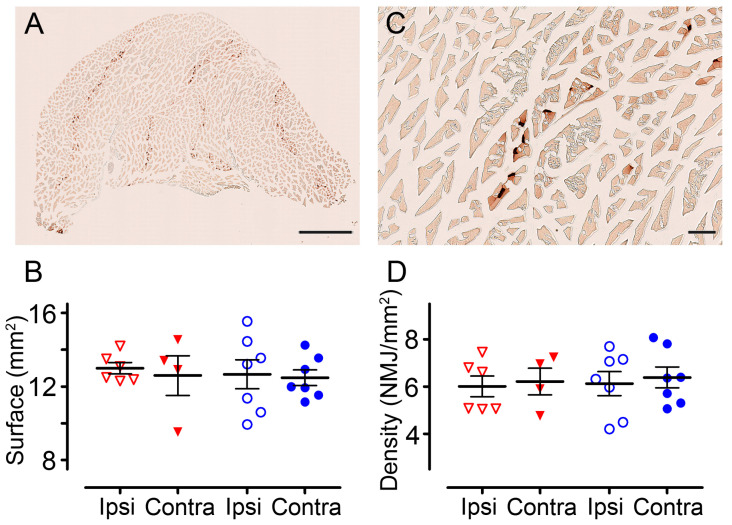
Figure 7.
Quantification of neuromuscular junctions in the gastrocnemius-soleus-plantaris muscular complex. Bright-field micrographs showing gastrocnemius–soleus–plantaris muscle complex of the hind limb ipsilateral to the spinal cord lesion in an untreated mouse (A). Quantification of muscle surface area assessed in pHIV-mCherry (red) and pHIV-Fgfr4 (blue) groups ipsilateral and contralateral to the lesion side (B). Neuromuscular junctions (C) quantification in muscles of pHIV-mCherry and pHIV-Fgfr4 mice were performed ipsilateral and contralateral to the lesion side (D). Data are expressed as mean per mouse ± SEM. Student’s unpaired t with Welch’s correction and paired t-test (comparison ipsi vs. contra). Number of female mice: 5 C57BL6/6J experimental mice; 7 C57BL6/6J control mice. Animals were sacrificed at 6 weeks after SCI. Scale bar: 1 mm (A) and 100 µm (C).

