Figure 3.
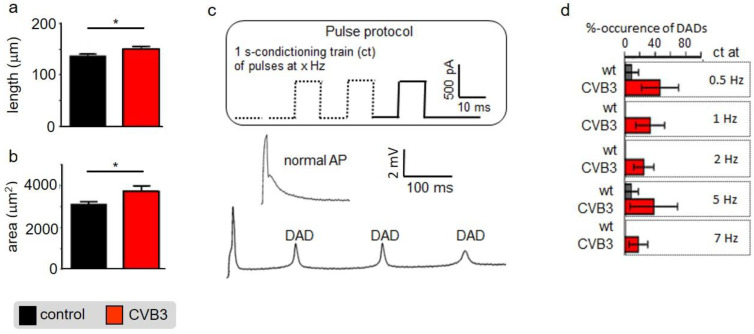
(a) Isolated mouse cardiomyocytes were optically measured under control conditions and under CVB3 expression. The cell length was quantified (n = 11; * indicates n < 0.05;) (b) Isolated mouse cardiomyocytes were optically measured under control conditions and under CVB3 expression. The cell area was quantified (n = 11; * indicates n < 0.05;) (c) Two exemplary induced action potentials of two different cardiomyocytes during patch clamp recordings and statistics on occurrence of delayed action potentials as relative events after stimulation at 0.5 to 7 Hz. (a) Example of a normal and a train of delayed depolarizations (DAD). (d) Cardiomyocytes isolated from transgenic CVB3ΔVP0 mice show a higher number of DAD events than the control group. The mean values ± SEM and the statistically relevant differences after a Mann–Whitney test (non-parametric) were plotted (n = 10–12 each group).

