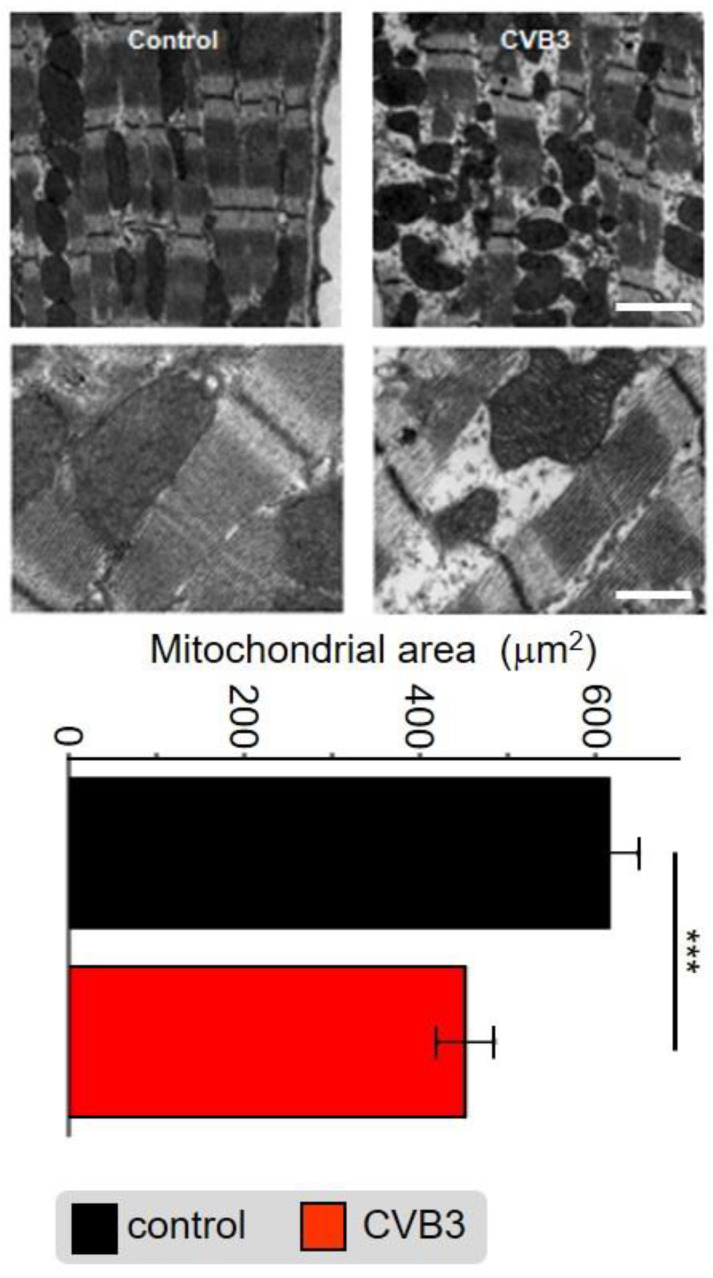
Figure 5.
Electron microscopic image of sarcomeric structures with co-localized mitochondria of mouse cardiomyocytes from wt mice (left) and CVB3ΔVP0-expressing mice (right). Scale bar top right—100 nm, scale bar bottom right—30 nm. Statistical analysis of the mitochondrial area in mouse cardiomyocytes from wt mice and CVB3ΔVP0 expressing mice shows mitochondrial degradation due to CVB3 expression (*** indicates p < 0.001; n = 5).

