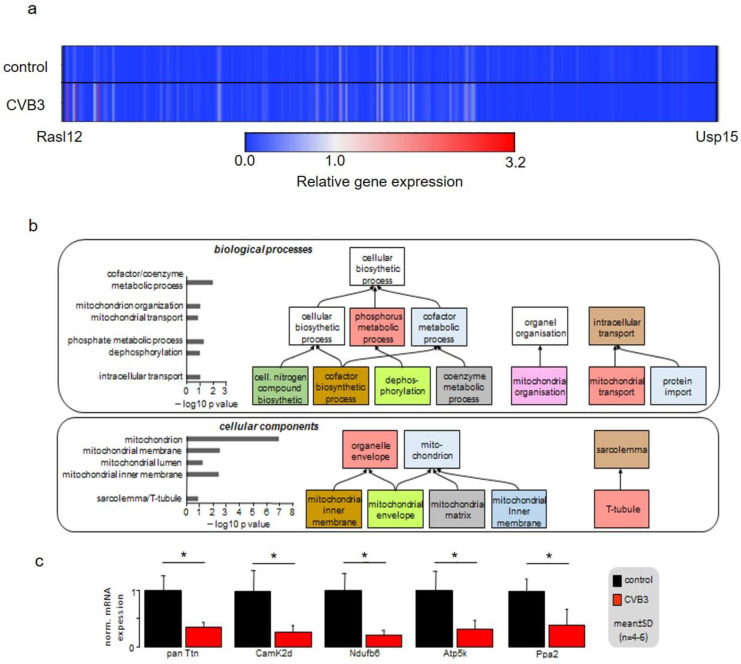
Figure 6.
(a) Gene expression pattern of control and CVB3-expressing mice illustrated as a heatmap. Gene expression levels were averaged and normalized to the expression of cardiac ACTC1, which were not altered under CVB3 expression. (b) Gene array analysis and qPCR validation of regulated key genes in age-matched wt and CVB3-transgen mice. GO analyses of biological processes and cellular components are shown. (c) RT-PCR verified downregulation of five key genes (* indicates p < 0.05).

