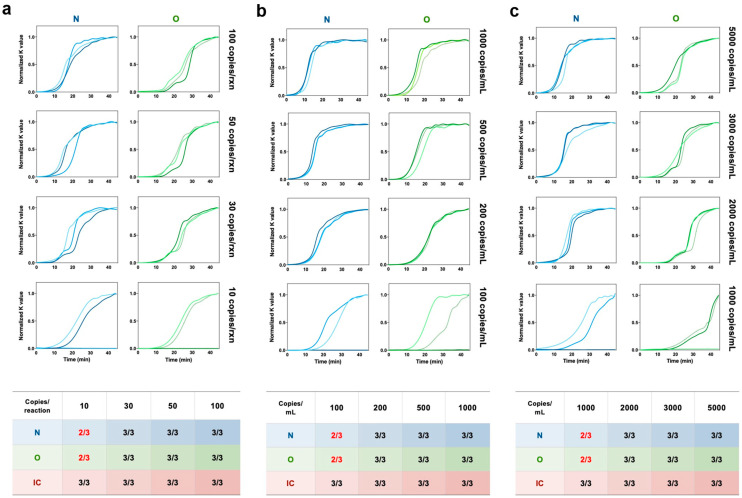
Figure 4.
LoD test of our SMART system for SARS-CoV-2 detection. (a) Real-time amplification signal of visible RT-LAMP reactions with synthetic SARS-CoV-2 viral RNA at concentrations of 10, 30, 50, and 100 copies/reaction on the chip, respectively. Human genomic DNA (20 ng) was introduced into each reaction chamber. (b) Real-time amplification signal of visible RT-LAMP reactions with NA extracted from SARS-CoV-2 mock swab samples with concentrations of 100, 200, 500, and 1000 copies/mL, respectively. (c) Real-time amplification signal of visible RT-LAMP reactions with NA directly released from SARS-CoV-2 mock swab samples with concentrations of 1000, 2000, 3000, and 5000 copies/mL, respectively. The table attached summarizes the performance of sensitivity tested with our SMART system. The IC detection results under different concentrations of virus template are listed in Figure S5. Each line in the figure represents an experimental repetition.

