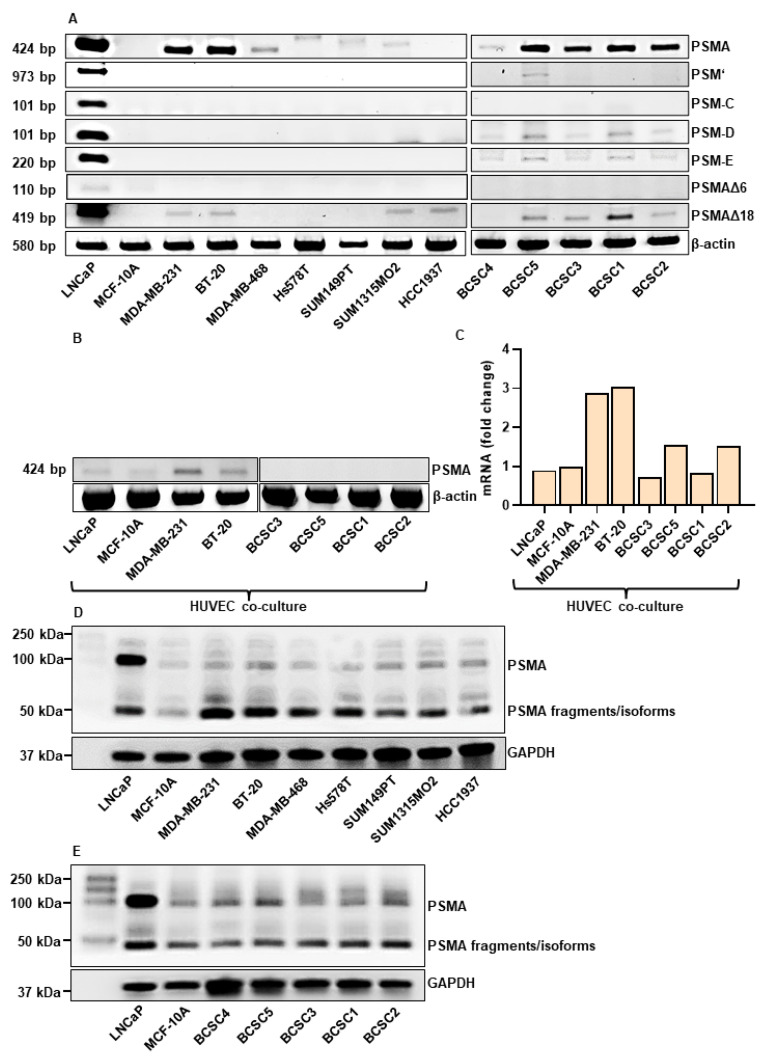
Figure 1.
Expression of PSMA isoforms in TNBC. (A) RT-PCR analysis of PSMA and isoforms (PSMA, PSM’, PSM-C, PSM-D, PSM-E, PSMAΔ6, and PSMAΔ18) in the indicated TNBC cell lines and BCSCs. β-actin represents the loading control. (B) RT-PCR analysis of PSMA in HUVECs co-cultured for 96 h in a trans-well system with the indicated cell lines. (C) qPCR analysis of PSMA in HUVECs co-cultured for 96 h in a trans-well system with the indicated cell lines. (D,E) SDS/Western Blot analysis of PSMA in TNBC (D) and BCSC (E) cell lines. Total cell lysates were used. GAPDH represents the loading control.

