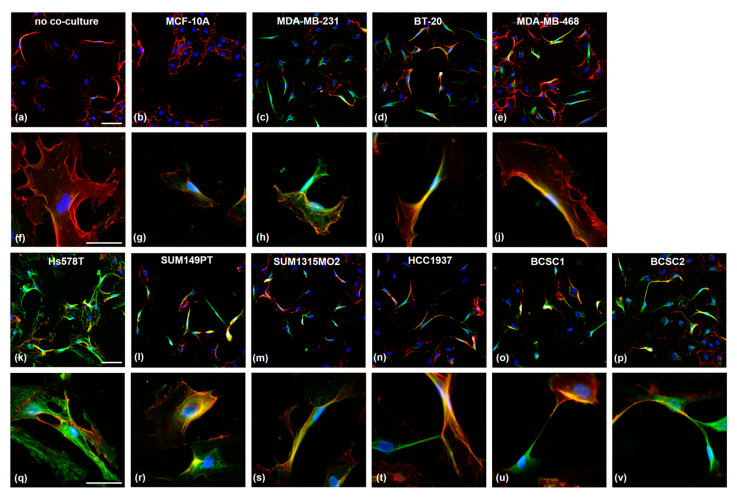
Figure 3.
Microscopic analysis of co-cultured HUVECs after co-staining with α-PSMA (green) and α-CD31 (red) antibodies. HUVECs were cultured alone (a,f) or co-cultured with the cell lines MCF-10A (b,g), MDA-MB-231 (c,h), BT-20 (d,i), MDA-MB-468 (e,j), Hs578T (k,q), SUM149PT (l,r), SUM1315MO2 (m,s), HCC1937 (n,t), BCSC1 (o,u), and BCSC2 (p,v) for 96 h in a trans-well system (0.4 µm pore size). Nuclei were stained with DAPI. Scale bars a–e and k–p: 100 µm; scale bars f–j and q–v: 50 µm.

