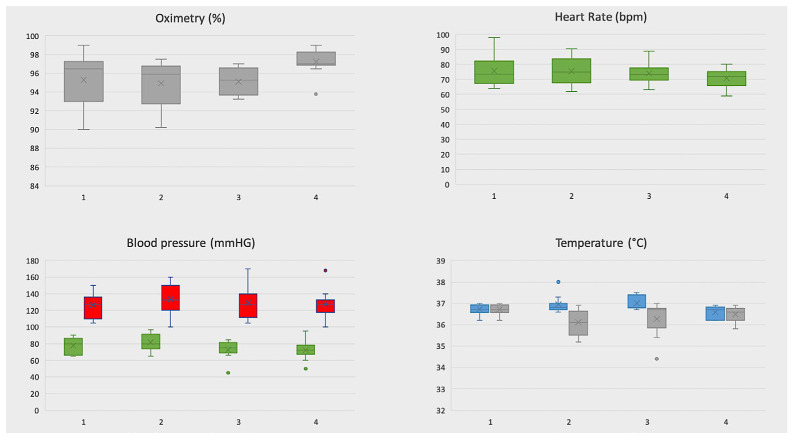
Figure 2.
Graphical representation of measurement for each vital sign. The box is bounded by the first (bottom) and third (top) quartiles. The median is represented as a line in the box whereas the mean as a X. In red systolic pression, in green diastolic pression, in blue higher temperature, in gray lower temperature.

