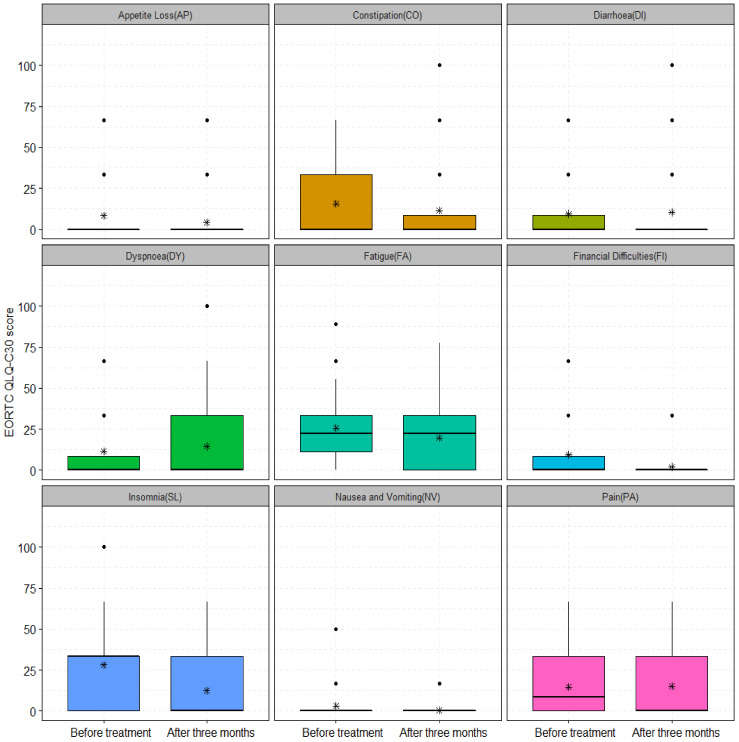
Figure 4.
The symptom scale scores of 32 patients treated with curative RCT and HT before and 12 months after treatment for: AP (8.33 ± 16.93 vs. 4.16 ± 14.04, p-value = 0.19), CO (15.62 ± 20.71 vs. 11.45 ± 23.35, p-value = 0.23), DI (9.37 ± 20.71 vs. 10.41 ± 23.09, p-value = 0.85), DY (11.45 ± 21.76 vs. 14.58 ± 26.69, p-value = 0.74), FA (25.69 ± 22.12 vs. 19.79 ± 19.49, p-value = 0.31), FI (20 ± 25.67 vs. 10 ± 23.41, p-value = 0.04), NV (3.12 ± 9.87 vs. 0.52 ± 2.94, p-value = 0.17), PA (14.58 ± 17.83 vs. 15.1 1 ± 20.89, p-value = 0.84), and SL (28.12 ± 26.92 vs. 12.50 ± 20.31, p-value = 0.01). The asterisks (*) represent the mean values; ns: non-significant with p-value > 0.05; *: significant with p-value < 0.05.

