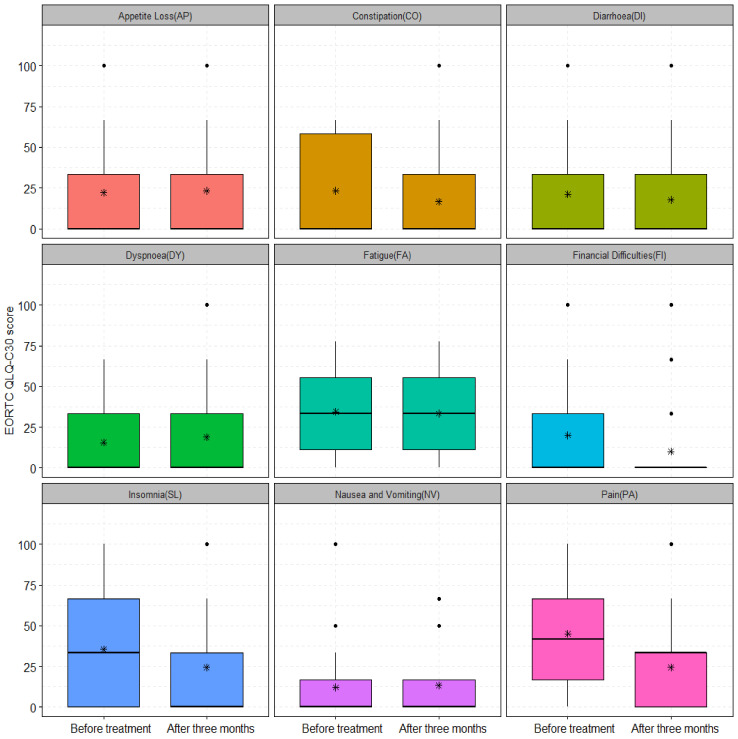
Figure 5.
The symptom scale scores of 30 patients treated with palliative RCT and HT before and three months after treatment for: AP (22.22 ± 31.96 vs. 23.33 ± 32.92, p-value = 0.94), CO (23.33 ± 29.23 vs. 16.66 ± 28.71, p-value = 0.31), DI (21.11 ± 29.23 vs. 17.77 ± 29.98, p-value = 0.39), DY (15.55 ± 20.96 vs. 18.88 ± 24.26, p-value = 0.63), FA (34.44 ± 23.94 vs. 33.33 ± 24.41, p-value = 0.86), FI (20 ± 25.67 vs. 10 ± 23.41, p-value = 0.04), NV (12.22 ± 23.13 vs. 13.33 ± 23.73, p-value = 0.92), PA (45 ± 33.37 vs. 24.44 ± 25.04, p-value = 0.01), and SL (35.55 ± 31.48 vs. 24.44 ± 31.48, p-value = 0.14). The asterisks (*) represent the mean values; ns: non-significant with p-value > 0.05; *: significant with p-value < 0.05.

