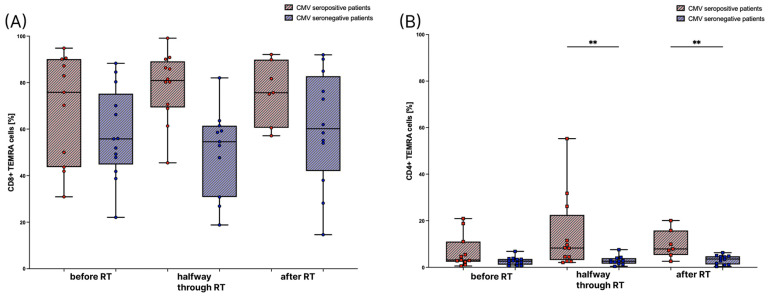
Figure 3.
Amounts of TEMRA cells before, during, and after radiotherapy (RT). TEMRA cells are depicted as percentages of CD8+ T cells in (A), and of CD4+ T cells in (B). TEMRA cells were measured in CMV seropositive patients, depicted in red, before RT (n = 11), halfway through RT (n = 12), and after RT (n = 7), as well as in CMV seronegative patients, depicted in blue, before RT (n = 13), halfway through RT (n = 11), and after RT (n = 12). For statistical analysis, the Kruskal–Wallis test was used to compare the amount of TEMRA cells halfway through and after RT to the amount before RT. For the analysis between the CMV seronegative and seropositive group within each time point, a non-parametric two-tailed Mann–Whitney U-test was applied (**: p < 0.01).

