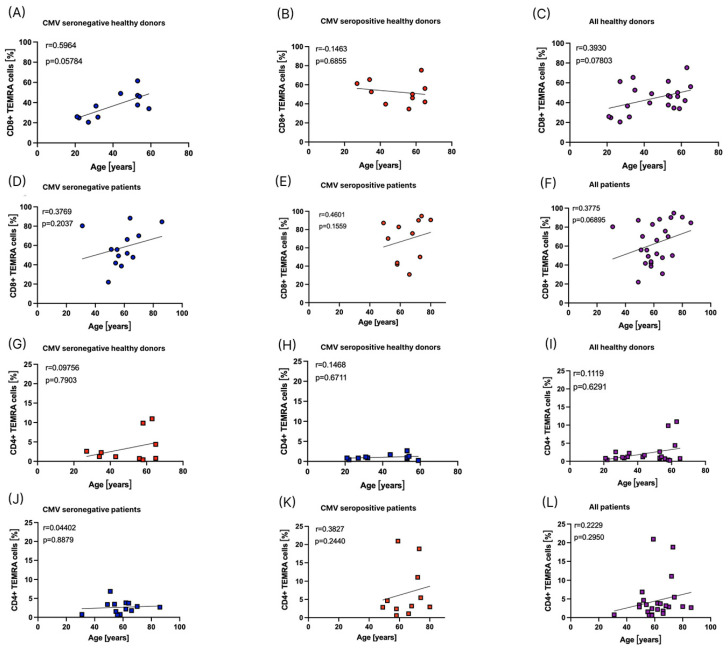
Figure 7.
Influence of age on the percentage of TEMRA cells. A Spearman correlation and a simple linear regression were performed to correlate the percentage of CD8+ TEMRA cells out of all CD8+ T cells to age, depicted as circles, (A–F) and the percentage of CD4+ TEMRA cells out of all CD4+ T cells to age, depicted as squares, (G–L). CMV seronegative individuals are depicted in blue, CMV seropositive individuals are depicted in red, and CMV seronegative and seropositive individuals combined are depicted in purple. (A) shows CMV seronegative healthy donors (n = 11). (B) shows CMV seropositive healthy donors (n = 10). (C) shows all healthy donors independent of CMV serostatus (n = 21). (D) shows CMV seronegative patients before the start of RT (n = 13). (E) shows CMV seropositive patients before the start of RT (n = 11). (F) shows all patients before the start of RT independent of CMV serostatus (n = 24). (G) shows CMV seronegative healthy donors (n = 11). (H) shows CMV seropositive healthy donors (n = 10). (I) shows all healthy donors independent of CMV serostatus (n = 21). (J) shows CMV seronegative patients before the start of RT (n = 13). (K) shows CMV seropositive patients before the start of RT (n = 11). (L) shows all patients before the start of RT independent of CMV serostatus (n = 24).

