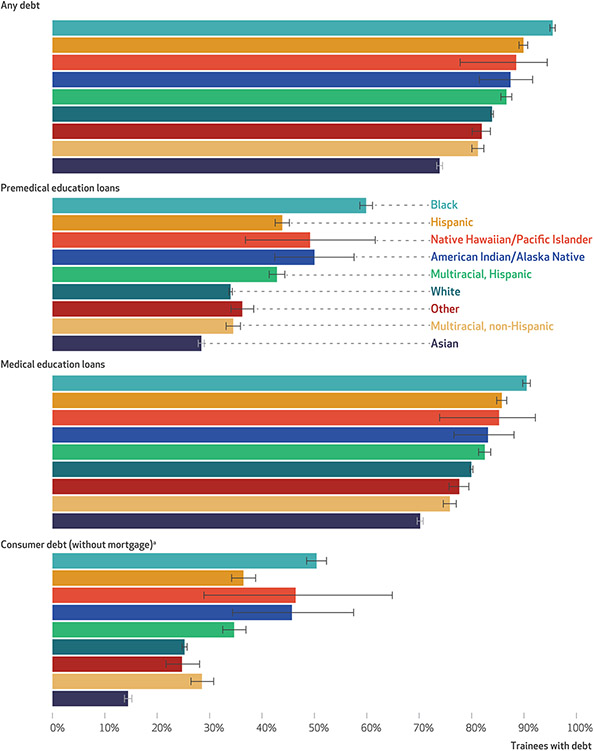
EXHIBIT 2. Percent of US postgraduate medical resident trainees with debt, by type of debt and by race and ethnicity, 2014–19.
source Authors’ analysis of trainee data from the Medical School Graduation Questionnaire and the Graduate Medical Education Track Resident Survey, both administered by the Association of American Medical Colleges. notes Across all debt types, debt prevalence differed by race and ethnicity (p < 0.001). Appendix exhibit A5 shows prevalence of consumer debt, including mortgages (see note 36 in text). “Question on noneducational consumer debt not including mortgage was asked of those who completed the Medical School Graduation Questionnaire before 2015 (42 percent of the sample).

