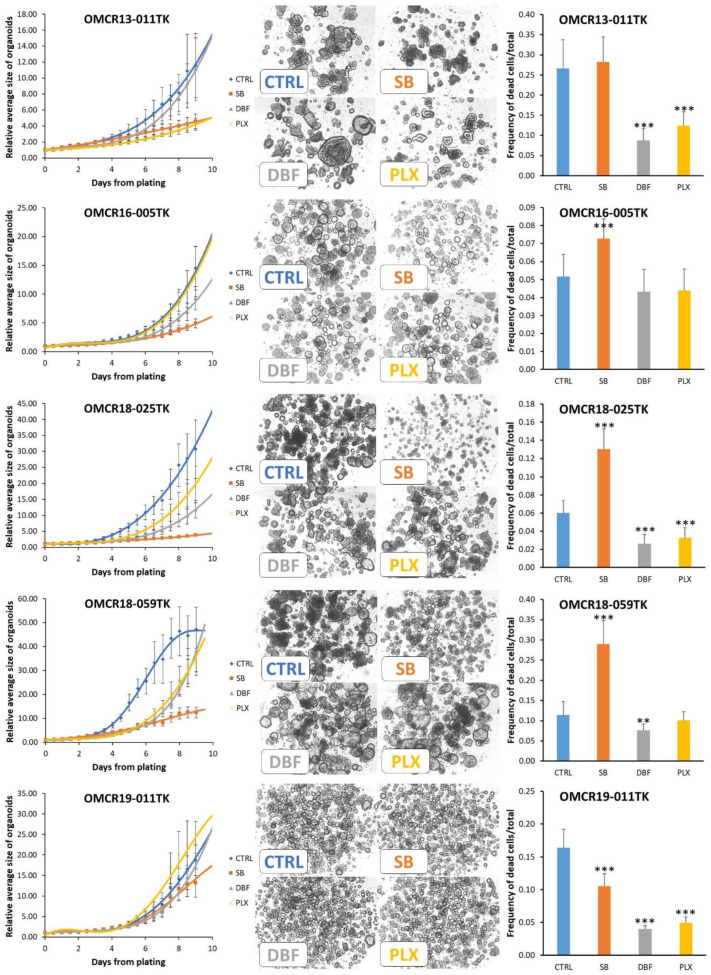
Figure 4.
Modulation of BRAF-mutated organoid growth by SB202190 (10 µM), Dabrafenib (1 µM) and PLX8394 (1 µM). Left column: interpolation of the growth curves live-monitored for 9 days (12 h steps); all data are normalized against point 0 values to reduce variations in plating efficiency among different organoids. Each experimental point represents the mean of 4–5 replicates (geltrex domes) in three tests. Mutations: OMCR13-011TK BRAF K601E; OMCR16-005TK and OMCR18-025TK BRAF V600E; OMCR18-059TK BRAF Val471dup; OMCR19-011TK BRAF G469V. The statistics of each experimental point vs. controls (CTRL) are detailed in TabS3. Center column: example images from the last experimental point; the organoids monitored in a single geltrex dome are shown. Right column: the cytotoxic effects of drugs were assessed using live fluorescent marking and normalized against total cells (in the same tests shown in the left column). Statistics vs. controls (CTRL): ** p ≤ 0.01; *** p ≤ 0.001.

