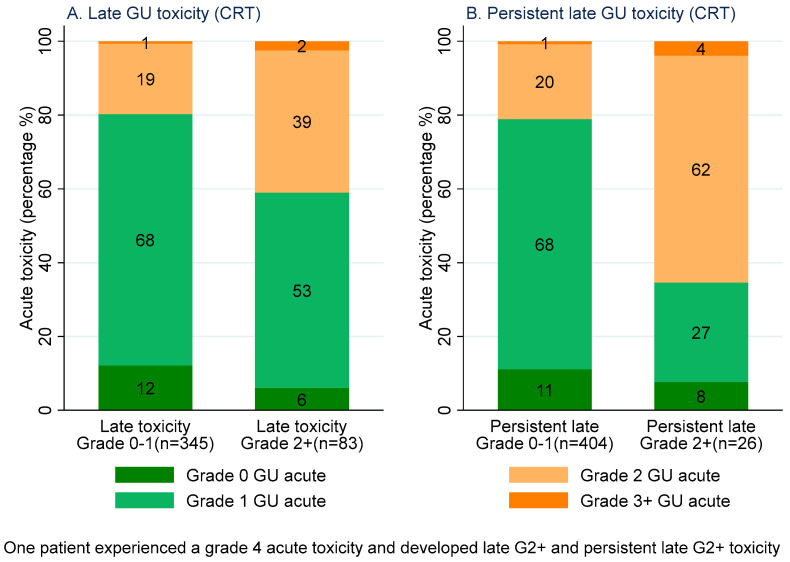
Figure 2.
Stacked bar graph: maximum grade CTCAE acute GU toxicity experienced for patients with Grade 0–1 (left of each figure) and Grade 2+ (right of each figure) late GU toxicity following CRT (left). Maximum grade CTCAE acute GU toxicity experienced by patients with grade 0–1 (left of each figure) and grade 2+ (right of each figure) persistent late GU toxicity following CRT (right).

