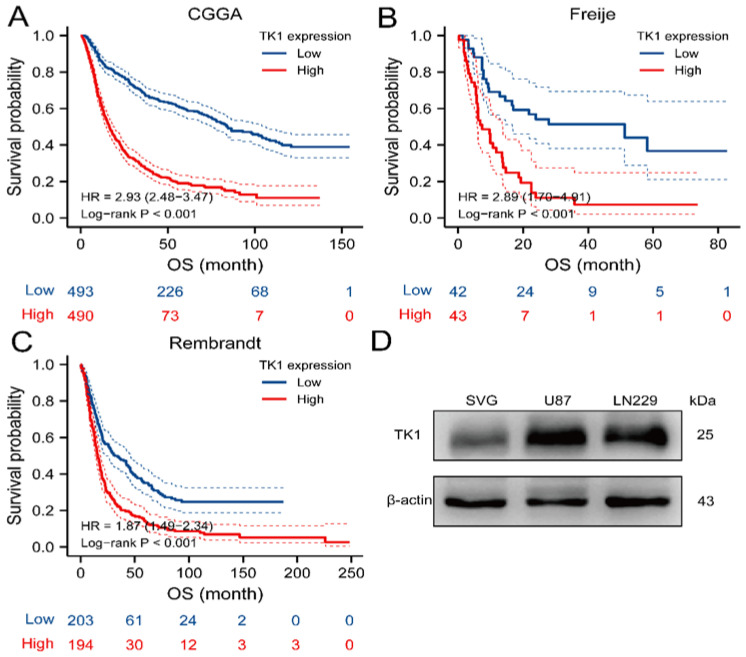
Figure 2.
Kaplan–Meier analysis of overall survival of TK1 and TK1 protein expression in glioma cell lines and normal brain cell line. (A–C) Higher expression of TK1 is associated with poor survival in three datasets, including CGGA (A), Freije (B), and Rembrandt (C). (D) Protein expression of TK1 in glioma cell lines and normal brain cell lines. Abbreviation: OS, overall survival.

