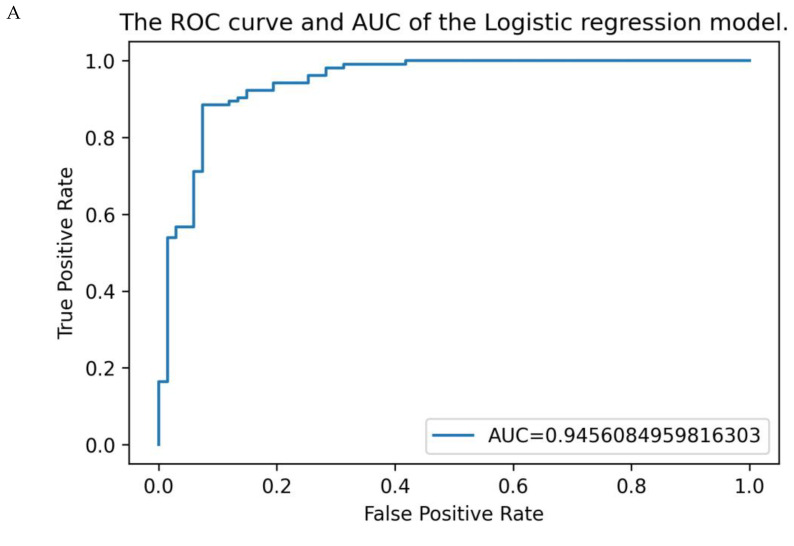
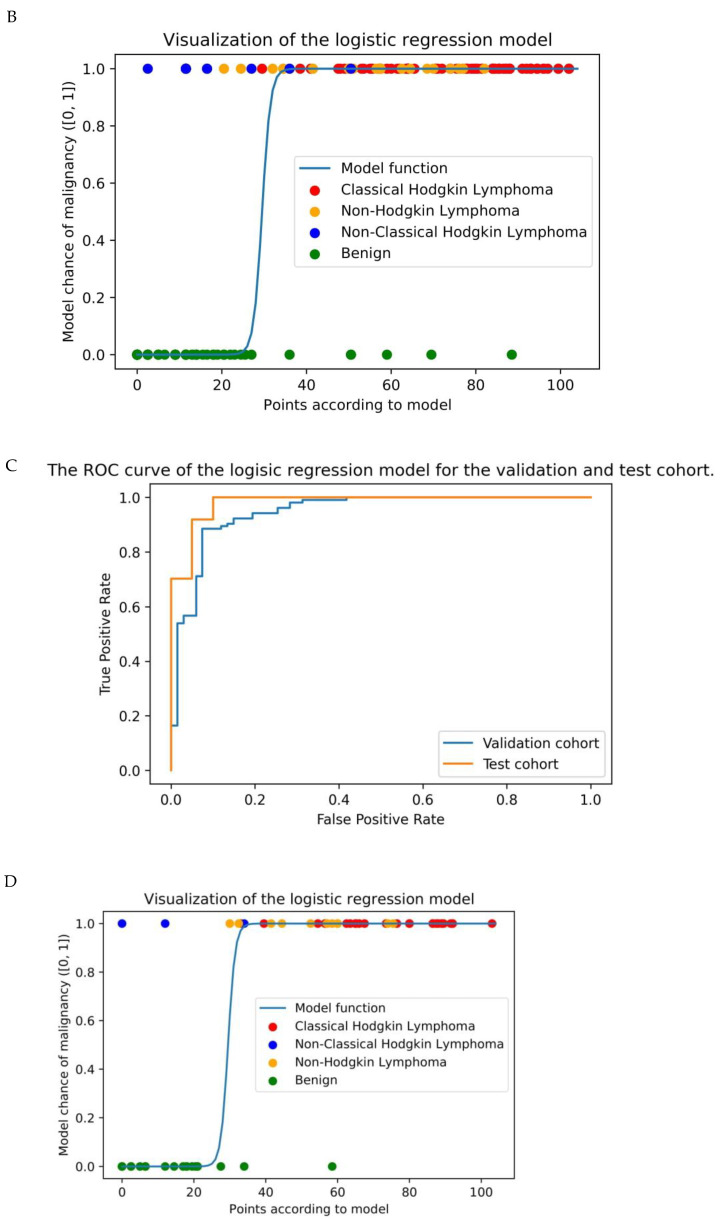
Figure 4.
ROC curve and logistic regression curve scored by the diagnostic model in the study population (A) (n = 171) and the test group (B) (n = 57). (A) ROC curve of the study group, with an AUC of 92% (95% CI 87–96%); (B) the blue line represents the model function. With a cut-off point of 27.5, the figure demonstrates that all cHL and 22 out of 24 NHL were detected with this diagnostic model and 61 out of 67 patients with a benign cause were diagnosed as benign according to the model; (C) ROC curve of the study group and test group together. The test group had a comparable AUC of 98% (95% CI 95–100%); (D) with a cut-off point at 27.5, the figure demonstrates that 55 out of 57 patients were diagnosed correctly. All 37 patients with cHL and NHL were diagnosed correctly, and 18 out 20 patients with a benign cause were diagnosed as benign according to the model.


