Figure 1.
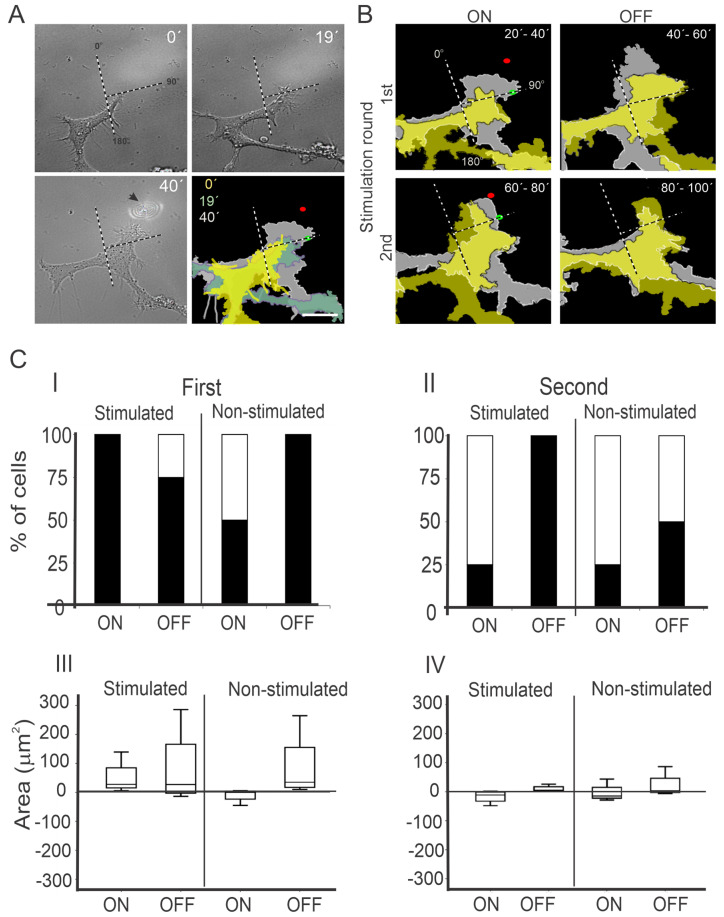
Optical guidance of PC12 cells during the ON and OFF period of laser stimulation. (A) Example of a time lapse of DIC microscopy images of PC12 cells obtained before NIR laser stimulation (T = 0′, T = 19′) and after 20 min of NIR laser irradiation (T = 40′). The arrow in the 40’ frame indicates the laser spot. The superposition of colored areas shows the direction of projection of the growth cones. (B) Example of growth cone projection while the laser was ON and OFF, respectively. The superimposed colored areas indicate the growth cone contour at beginning (yellow) and the end (gray) of the temporal periods indicated at the right-top corner of each frame. Dotted lines in (A) and (B) show the division in two zones (0–90° and 90–180°), green and red dots mark the position of the laser spot at the beginning and the end of the stimulation, respectively. (C) Quantification of PC12 growth cone projection. Subpanels I and II show the percentage of cells with increased (black) or decreased (white) growth cone area at stimulated (0–90°) and non-stimulated quadrants (90–180°), and during the laser ON and OFF periods at the first (I) and second (II) round of laser stimulation. III and IV show box-and-whisker diagrams of the difference of the growth cone areas at the end and beginning of the 20 min periods (refer to Section 2.4), at stimulated and non-stimulated quadrants, during the ON and OFF periods, in the first (III) and second (IV) round of laser stimulation. The scale bars in (A,B) represent 15 µm.

