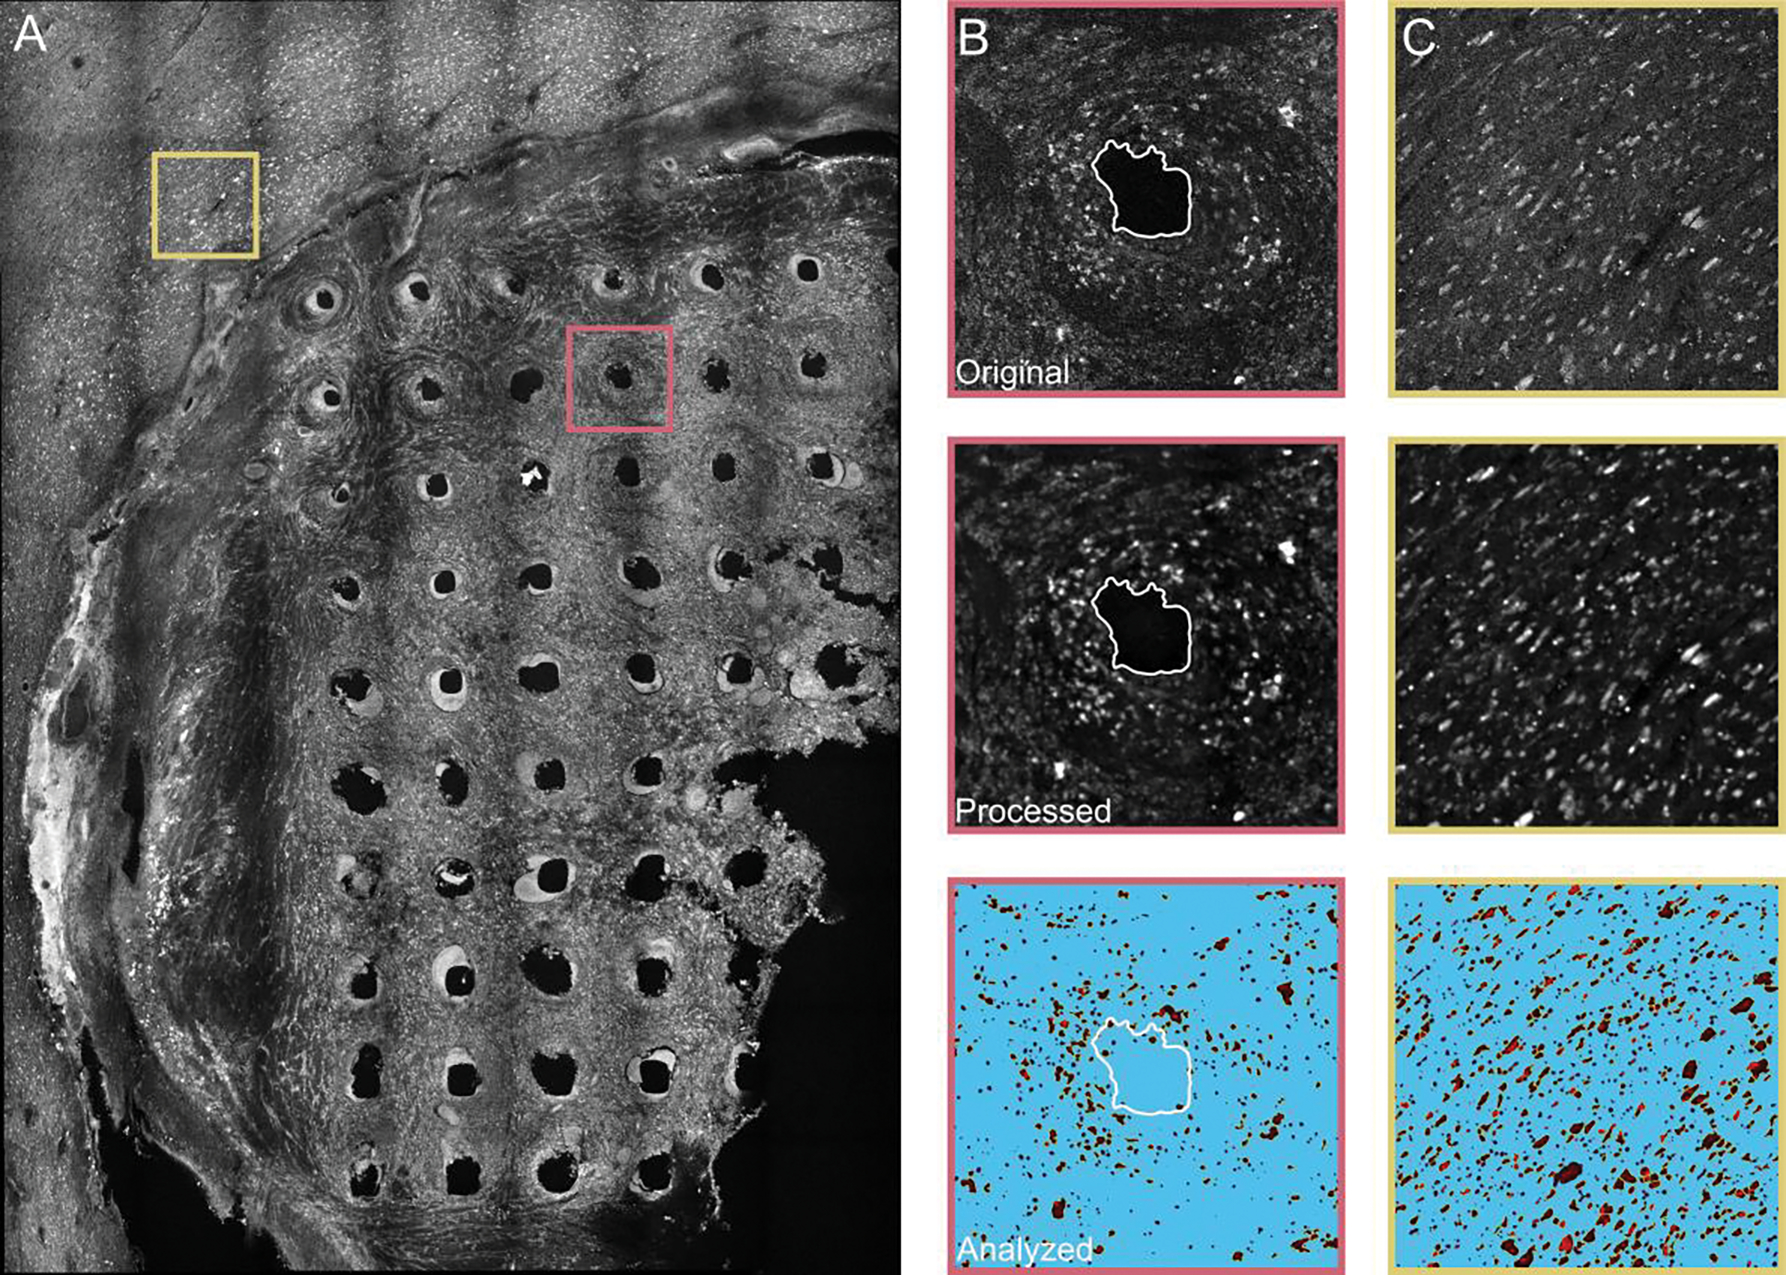
Figure 2.

Tissue analysis of NeuN staining of slice 11 in the left sensory cortex under the LS array. A) Confocal image of slice 11 (tissue 1000–1100 μm from brain surface) at a z-stack approximately in the center of the slice. Slice 11 shows 50 intact electrode shank holes and nearby non-implanted tissue. The pink box (400 μm × 400 μm) outlines a representative electrode shank hole seen in (B) and yellow box outlines the non-implanted tissue seen in (C). The representative electrode shank hole (B) and non-implanted tissue (C) are depicted in original form (top), after filtering and other processing steps (middle), and after analysis in ImageJ with the Analyze Particles program (bottom). Images in (B) and (C) are 400 μm × 400 μm.
